Unlock a world of possibilities! Login now and discover the exclusive benefits awaiting you.
- Qlik Community
- :
- All Forums
- :
- QlikView App Dev
- :
- Display max value based on dimensions values
- Subscribe to RSS Feed
- Mark Topic as New
- Mark Topic as Read
- Float this Topic for Current User
- Bookmark
- Subscribe
- Mute
- Printer Friendly Page
- Mark as New
- Bookmark
- Subscribe
- Mute
- Subscribe to RSS Feed
- Permalink
- Report Inappropriate Content
Display max value based on dimensions values
Hi,
I'm new to QlikView and I'm trying to accomplish something that seems to me quite easy, but couldn't find the solution so far. I have one table like the next one:
KEY;DESCRIPTION;VALUE
1;Desc1;Value1
2;Desc1;Value2
3;Desc2;Value3
4;Desc2;Value4
How can I retrieve the value for the max KEY aggregated by description. The correct output would be:
2;Desc1;Value2
4;Desc2;Value4
I want to build a chart where the Description is the dimension and I only want to display the value for the maximum key (no sums or counts).
If it was in SQL it would be something like this;
select max(key), description, value from table
group by description, value;
Thanks!
Accepted Solutions
- Mark as New
- Bookmark
- Subscribe
- Mute
- Subscribe to RSS Feed
- Permalink
- Report Inappropriate Content
Andre,
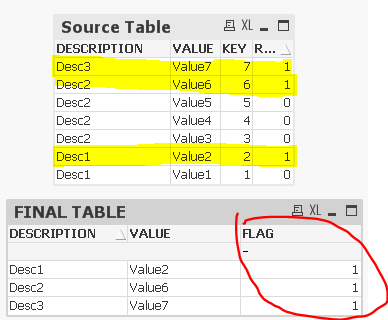
In that case you can use the below code to create another flag. It orders by Description and Key and assigns "1" for the description with max(Key).
FinalTable:
load DESCRIPTION, VALUE,KEY,
if(DESCRIPTION=Previous(DESCRIPTION),0,1) as Flag
Resident SourceTable
Order by DESCRIPTION,KEY desc;
You can add Description and Value as dimensions and Flag as expression. It will display only the records which have flag=1 (the ones with the highest value of KEY). If you do not wish to show the FLAG column in the front end, go to presentation tab and hide the column. I have added a few more rows to your data just to make sure...
Cheers!
Manas
- Mark as New
- Bookmark
- Subscribe
- Mute
- Subscribe to RSS Feed
- Permalink
- Report Inappropriate Content
Hello,
If DESCRIPTION is the only dimension, you can just use Max(KEY) as the expression.
Else, you can use aggr function - aggr(max(KEY),DESCRIPTION)
Hope this helps!
Manas
- Mark as New
- Bookmark
- Subscribe
- Mute
- Subscribe to RSS Feed
- Permalink
- Report Inappropriate Content
HI
Try like this
Load max(key) as Key, description, value from table
group by description, value;
Or
Description as dimension, max(Key) and Sum(value) as expression
Please close the thread by marking correct answer & give likes if you like the post.
- Mark as New
- Bookmark
- Subscribe
- Mute
- Subscribe to RSS Feed
- Permalink
- Report Inappropriate Content
If you want to limit the no of rows during reload itself, you can use left join, like in the below code.
source:
load * Inline [
KEY,DESCRIPTION,VALUE
1,Desc1,Value1
2,Desc1,Value2
3,Desc2,Value3
4,Desc2,Value4];
final:
load DESCRIPTION, max(KEY) as KEY Resident source
Group by DESCRIPTION;
left join(final)
load KEY, DESCRIPTION,VALUE Resident source;
drop Table source;
- Mark as New
- Bookmark
- Subscribe
- Mute
- Subscribe to RSS Feed
- Permalink
- Report Inappropriate Content
Have you looked into AGGR function too
AGGR(max(key),description)
- Mark as New
- Bookmark
- Subscribe
- Mute
- Subscribe to RSS Feed
- Permalink
- Report Inappropriate Content
I already took a look at the aggr function. If I use aggr(max(KEY),DESCRIPTION), it will return me the maximum key for every description. But how can I filter the expression just to retrieve the VALUE at the maximum KEY for every DESCRIPTION?
In the presented example, I want a chart that contains a column with Desc1 and Value1, and another column with Desc2 and Value 4 without restricting the data being loaded.
Thanks!
- Mark as New
- Bookmark
- Subscribe
- Mute
- Subscribe to RSS Feed
- Permalink
- Report Inappropriate Content
Andre,
In that case you can use the below code to create another flag. It orders by Description and Key and assigns "1" for the description with max(Key).
FinalTable:
load DESCRIPTION, VALUE,KEY,
if(DESCRIPTION=Previous(DESCRIPTION),0,1) as Flag
Resident SourceTable
Order by DESCRIPTION,KEY desc;
You can add Description and Value as dimensions and Flag as expression. It will display only the records which have flag=1 (the ones with the highest value of KEY). If you do not wish to show the FLAG column in the front end, go to presentation tab and hide the column. I have added a few more rows to your data just to make sure...
Cheers!
Manas
- Mark as New
- Bookmark
- Subscribe
- Mute
- Subscribe to RSS Feed
- Permalink
- Report Inappropriate Content
you can do it at graph time using "FirstSortedValue" as below:
FirstSortedValue(DESCRIPTION,-KEY) and
FirstSortedValue(VALUE,-KEY)