Unlock a world of possibilities! Login now and discover the exclusive benefits awaiting you.
- Qlik Community
- :
- All Forums
- :
- QlikView App Dev
- :
- Display the first Level of a Bar Chart as Stacked
Options
- Subscribe to RSS Feed
- Mark Topic as New
- Mark Topic as Read
- Float this Topic for Current User
- Bookmark
- Subscribe
- Mute
- Printer Friendly Page
Turn on suggestions
Auto-suggest helps you quickly narrow down your search results by suggesting possible matches as you type.
Showing results for
Anonymous
Not applicable
2018-09-07
03:05 AM
- Mark as New
- Bookmark
- Subscribe
- Mute
- Subscribe to RSS Feed
- Permalink
- Report Inappropriate Content
Display the first Level of a Bar Chart as Stacked
Hi experts,
I have a chart which compares through Years and Quarters. The Quarter is displayed as stacked, but the Year still displayed as grouped.
Is it possible to display the 1st Level (i.e Year) as stacked also? Then on clicking, it will expand into the 2nd level (i.e Quarter) and shows the below chart.
I tried drill-down, but then on clicking it will display quarters for only one year, while the purpose is to show the difference through some Years and Quarters.
Hope I express the expected result clearly. 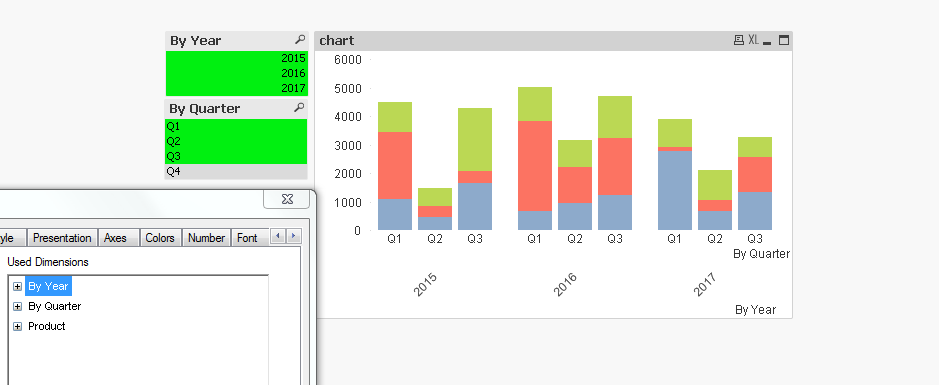
183 Views
0 Replies