Unlock a world of possibilities! Login now and discover the exclusive benefits awaiting you.
- Qlik Community
- :
- All Forums
- :
- QlikView App Dev
- :
- Re: Displaying Millions symbol when axis still has...
- Subscribe to RSS Feed
- Mark Topic as New
- Mark Topic as Read
- Float this Topic for Current User
- Bookmark
- Subscribe
- Mute
- Printer Friendly Page
- Mark as New
- Bookmark
- Subscribe
- Mute
- Subscribe to RSS Feed
- Permalink
- Report Inappropriate Content
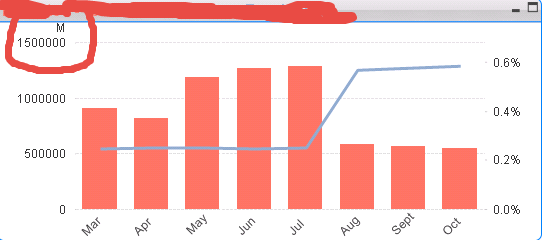
Displaying Millions symbol when axis still has 000's
How can I make my Millions symbol display, without using a 000's symbol
this is what my chart looks like
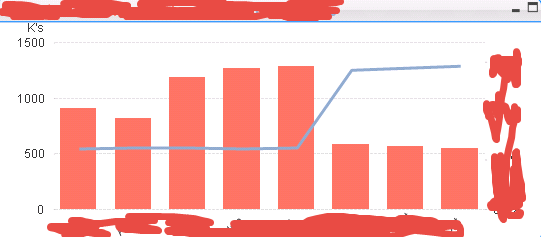
When I take K's out of thousands, and Add 'M' into millions, nothing happens, and my numbers expand on the axis to the true value. I.E. 1500 goes to 1,500,000. I believe this is an issue because there are values that are less than a million. How can I get my axis to show .5, 1, 1.5 and the top be 'M'....
- « Previous Replies
-
- 1
- 2
- Next Replies »
- Mark as New
- Bookmark
- Subscribe
- Mute
- Subscribe to RSS Feed
- Permalink
- Report Inappropriate Content
num(YourExpression)/1000000 , '$#,##0.00 M')
- Mark as New
- Bookmark
- Subscribe
- Mute
- Subscribe to RSS Feed
- Permalink
- Report Inappropriate Content
That Formula, coupled with my expression, did not work:
=NUM(IF(CurYTDFlag = '1', Furnishings)/1000000, '$#,##0.00 M')
I have two expressions in my chart.
It's causing the %'s on the Secondary axis to be way higher than they should be, and I didn't even change the formatting for that expression. Also, it did not add M's to signify Millions on the left axis...
- Mark as New
- Bookmark
- Subscribe
- Mute
- Subscribe to RSS Feed
- Permalink
- Report Inappropriate Content
If a post helps to resolve your issue, please accept it as a Solution.
- Mark as New
- Bookmark
- Subscribe
- Mute
- Subscribe to RSS Feed
- Permalink
- Report Inappropriate Content
It will not add M to the Axis, instead it will add M to the data points on your trend line (if you show values on data points)
- Mark as New
- Bookmark
- Subscribe
- Mute
- Subscribe to RSS Feed
- Permalink
- Report Inappropriate Content
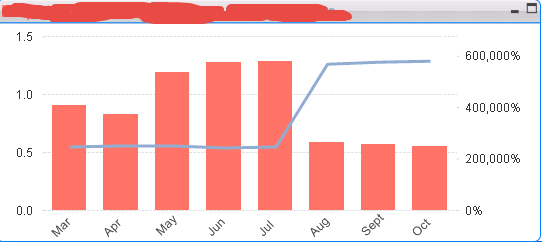
This is great, but how are you getting the values on your axis to switch to millions. They still are represented by full value i.e. 1,500,000 ; 1,000,000 ; 500,000
- Mark as New
- Bookmark
- Subscribe
- Mute
- Subscribe to RSS Feed
- Permalink
- Report Inappropriate Content
- Mark as New
- Bookmark
- Subscribe
- Mute
- Subscribe to RSS Feed
- Permalink
- Report Inappropriate Content
You will need to divide them /1000000
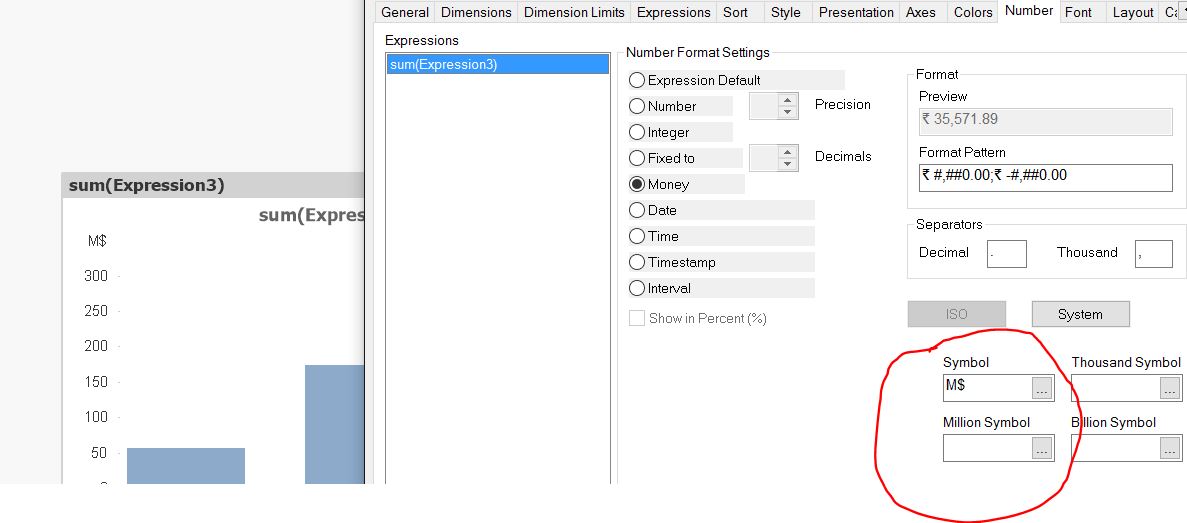
Just FYI: When you use formatting functions with your expression like NUM(sum(Expression3)/100,'M$#,##0')
you should check Expression Default in the Number formatting tab(the top most option button) for the formatting to take effect.
So two options
1) use NUM(sum(Expression3)/100,'M$#,##0') in expression and check Expression Default
2) Normal Expression/1000000 and Check Money formatting and add 'M$' manually to symbol.
If a post helps to resolve your issue, please accept it as a Solution.
- Mark as New
- Bookmark
- Subscribe
- Mute
- Subscribe to RSS Feed
- Permalink
- Report Inappropriate Content
Again, this method does NOT work with my data.
I have two expressions:
EXPRESSION 1:
IF(CurYTDFlag = 1, FURNISHINGS)
EXPRESSION 2:
=(COUNT({<[Var1_Dummy] = {'0'}, Var2_dummy = {'1'}, Var3_Dummy = {'1'}, Type = {'Vehicle/Home EQ', 'Financial Card'}, Month -= {$(vCurrentMonth)}, CurYTDFlag = {'1'}>} Pkey) +
COUNT({<Var4Dummy = {'1'}, Month -= {$(vCurrentMonth)}, CurYTDFlag = {'1'}>}[Control Number])) / (Furnishings)
View:
Changing EXPRESSION 1:
(IF(CurYTDFlag = 1, FURNISHINGS))/1000000
Results in:

Why is changing the value on ONE axis affecting the values on another? Why is it muliplying my % by 1,000,000. I have in no way altered the formatting of the right axis, or the expression..
- Mark as New
- Bookmark
- Subscribe
- Mute
- Subscribe to RSS Feed
- Permalink
- Report Inappropriate Content
I changed my second expression to:
=((COUNT({<[Var1_Dummy] = {'0'}, Var2_dummy = {'1'}, Var3_Dummy = {'1'}, Type = {'Vehicle/Home EQ', 'Financial Card'}, Month -= {$(vCurrentMonth)}, CurYTDFlag = {'1'}>} Pkey) +
COUNT({<Var4Dummy = {'1'}, Month -= {$(vCurrentMonth)}, CurYTDFlag = {'1'}>}[Control Number])) / (Furnishings) ) / 1000000
and it formatted it back to .4%, .5%, .6%
but why does changing one expression affecting the axis of a totally different expression, that is formatted a different way. it multiplied the other axis by 1,000,000 when I divided the first expression. is this a bug in qlikview?
- « Previous Replies
-
- 1
- 2
- Next Replies »