Unlock a world of possibilities! Login now and discover the exclusive benefits awaiting you.
- Qlik Community
- :
- All Forums
- :
- QlikView App Dev
- :
- Re: Displaying Month From Different Dates in one R...
- Subscribe to RSS Feed
- Mark Topic as New
- Mark Topic as Read
- Float this Topic for Current User
- Bookmark
- Subscribe
- Mute
- Printer Friendly Page
- Mark as New
- Bookmark
- Subscribe
- Mute
- Subscribe to RSS Feed
- Permalink
- Report Inappropriate Content
Displaying Month From Different Dates in one Report
HI Guys - I have a very strange requirement and I am having a bit of trouble figuring this one.
I need to display month of different dates from different tables in one single report as a dimension. it is not possible to combine these dates in the back end as they are from different tables in different modules and doesn't have any relation between them.
The months needs to extracted and displayed from each of these dates for each of these rows.
| Jan | Feb | Mar | Apr | May | Jun | Q2 | Jul | Aug | Sep | Q3 | Oct | Nov | Dec | Dec | Q4 | Total Year | |
| 2018 Sales Orders by Date1 | 12 | 12 | 12 | 12 | 12 | 12 | 12 | 12 | 12 | 12 | 12 | 12 | 12 | 12 | 12 | 12 | 12 |
| 2018 Purchase Orders by Date2 | 1345 | 1345 | 1345 | 1345 | 1345 | 1345 | 1345 | 1345 | 1345 | 1345 | 1345 | 1345 | 1345 | 1345 | 1345 | 1345 | 1345 |
| 2018 Forecast by Date3 | 1456 | 1456 | 1456 | 1456 | 1456 | 1456 | 1456 | 1456 | 1456 | 1456 | 1456 | 1456 | 1456 | 1456 | 1456 | 1456 | 1456 |
I guess this table should give you an idea of what i am trying to do, first row values should be displayed by using month from Date1,
second row values should be displayed by using month from Date 2 and so on, the difficult task here is combining and displaying all these into a single report so when the user downloads it, it goes in one excel. these all are different dates from different tables in different modules, so there is no way of joining these, but just for this one report for comparison purposes i need to display like this.
How to create monthly buckets with different dates in one single report is what my question is.
- Mark as New
- Bookmark
- Subscribe
- Mute
- Subscribe to RSS Feed
- Permalink
- Report Inappropriate Content
Hi,
Please find attached the Solution Qvw, i have used the Date bridge in-order to combine the different dates and also used inline table to create the dimension fields values as Forecast value, purchase order, sales order.
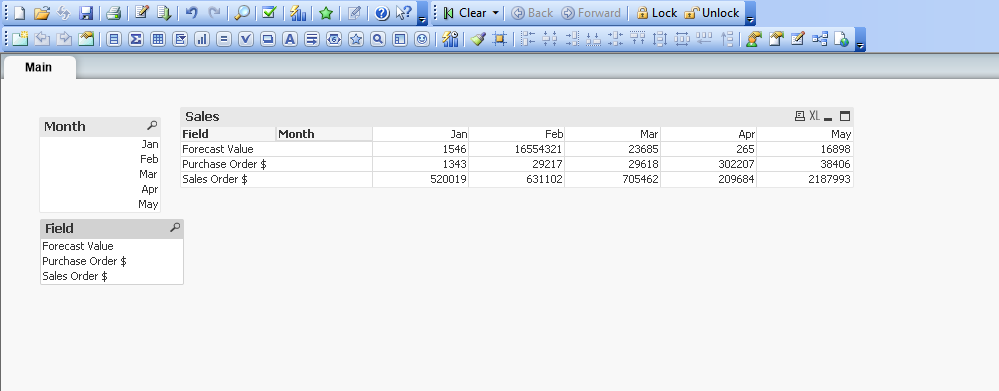
If you find this helpful please mark as helpful or correct.
Regards,
Bhasker Kumar