Unlock a world of possibilities! Login now and discover the exclusive benefits awaiting you.
- Qlik Community
- :
- All Forums
- :
- QlikView App Dev
- :
- Displaying Same chart in one container(Designing)
- Subscribe to RSS Feed
- Mark Topic as New
- Mark Topic as Read
- Float this Topic for Current User
- Bookmark
- Subscribe
- Mute
- Printer Friendly Page
- Mark as New
- Bookmark
- Subscribe
- Mute
- Subscribe to RSS Feed
- Permalink
- Report Inappropriate Content
Displaying Same chart in one container(Designing)
Hiii I have 2 same charts used in one container.
I got a requirement such that there should be 2 same charts in one container itself.
I have achieved it however I want to design the chart such a way that user should look it as one chart
I am facing gap between this same charts as you can view red highlighted portion in the charts in attachment.
can anyone help me out for the same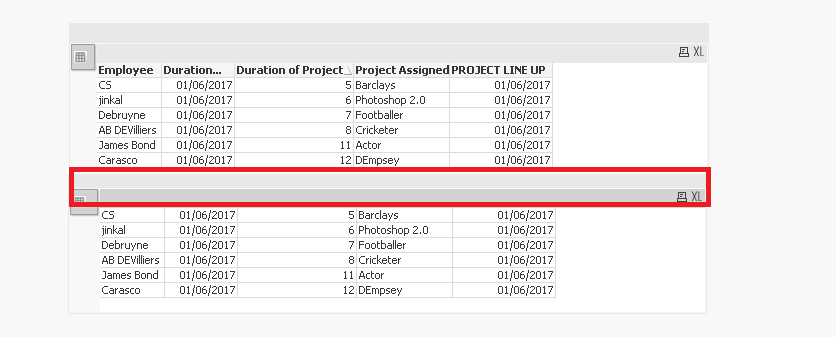
- Mark as New
- Bookmark
- Subscribe
- Mute
- Subscribe to RSS Feed
- Permalink
- Report Inappropriate Content
Hi,
I think, the header can not be removed by settings . Can apply a workaround?
As variant, both tables in the script can be unloaded into one table with the addition of a flag, for example, for the first table "0", for the second table "1". Further in the UI table, you can simply enable sorting by flag and make the flag field invisible.
Example in attached file.
Regards,
Andrey
- Mark as New
- Bookmark
- Subscribe
- Mute
- Subscribe to RSS Feed
- Permalink
- Report Inappropriate Content
Hi,
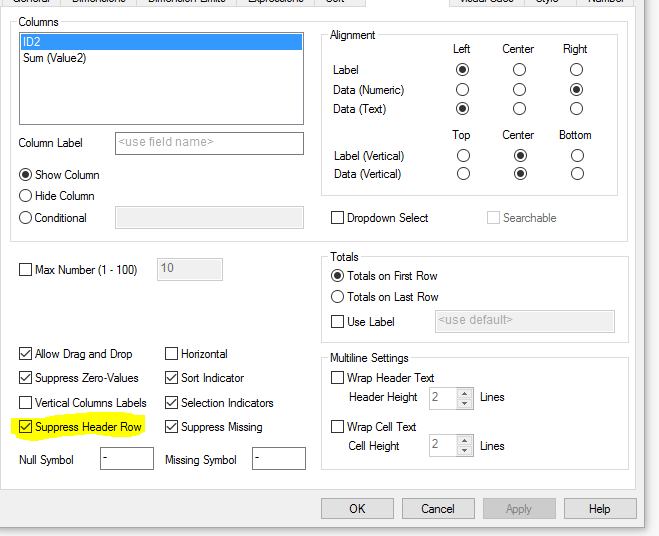
On the presentation tab for your second chart, just check the 'suppress header' box