Unlock a world of possibilities! Login now and discover the exclusive benefits awaiting you.
- Qlik Community
- :
- All Forums
- :
- QlikView App Dev
- :
- Displaying identical column in Straight Table
- Subscribe to RSS Feed
- Mark Topic as New
- Mark Topic as Read
- Float this Topic for Current User
- Bookmark
- Subscribe
- Mute
- Printer Friendly Page
- Mark as New
- Bookmark
- Subscribe
- Mute
- Subscribe to RSS Feed
- Permalink
- Report Inappropriate Content
Displaying identical column in Straight Table
Dear QV Experts,
One straight table, CustomerName, ItemNumber are dimensions.
Sum(Sales) is Expression.
I have two rows,
CustomerName ItemNumber Sum(Sales)
ABC 1234 1000
BCD 1234 2000
But it is displaying as
ItemNumber Sum(Sales)
1234 1000
1234 2000
Though it is different customers but i am not displaying customers can we able to show the Identical Numbers in one row
ItemNumber Sum(Sales)
1234 3000
The qvw attached.
Please suggest me.
Thanks in Advance
- Tags:
- new_to_qlikview
- « Previous Replies
-
- 1
- 2
- Next Replies »
Accepted Solutions
- Mark as New
- Bookmark
- Subscribe
- Mute
- Subscribe to RSS Feed
- Permalink
- Report Inappropriate Content
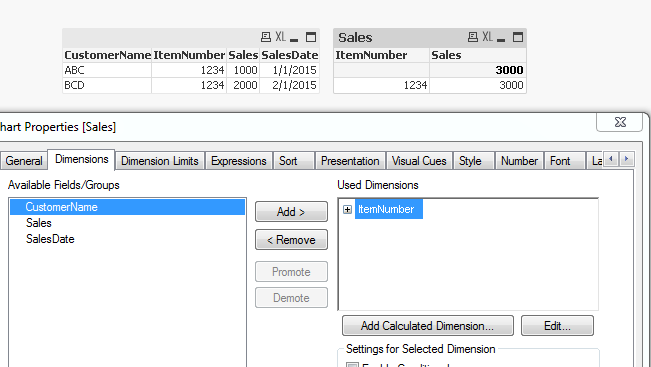
Alternatively, you can use this expression if keeping the CustomerName dimension is a requirement:
Sum(Aggr(Sum(Sales), ItemNumber))
- Mark as New
- Bookmark
- Subscribe
- Mute
- Subscribe to RSS Feed
- Permalink
- Report Inappropriate Content
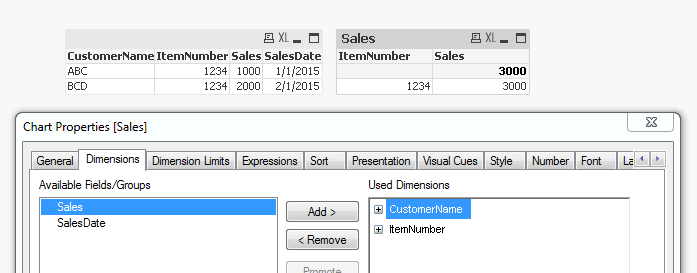
Remove CustomerName from the dimension and you will get the desired result:
- Mark as New
- Bookmark
- Subscribe
- Mute
- Subscribe to RSS Feed
- Permalink
- Report Inappropriate Content
What do you want?
You can delete CustomerName from the dimensions instead of hiding it. Then you should get 1 row.
- Mark as New
- Bookmark
- Subscribe
- Mute
- Subscribe to RSS Feed
- Permalink
- Report Inappropriate Content
Alternatively, you can use this expression if keeping the CustomerName dimension is a requirement:
Sum(Aggr(Sum(Sales), ItemNumber))
- Mark as New
- Bookmark
- Subscribe
- Mute
- Subscribe to RSS Feed
- Permalink
- Report Inappropriate Content
Thanks Sunny. It works for me now. Thanks a lot.
- Mark as New
- Bookmark
- Subscribe
- Mute
- Subscribe to RSS Feed
- Permalink
- Report Inappropriate Content
Awesome 
- Mark as New
- Bookmark
- Subscribe
- Mute
- Subscribe to RSS Feed
- Permalink
- Report Inappropriate Content
Dear QV Experts,
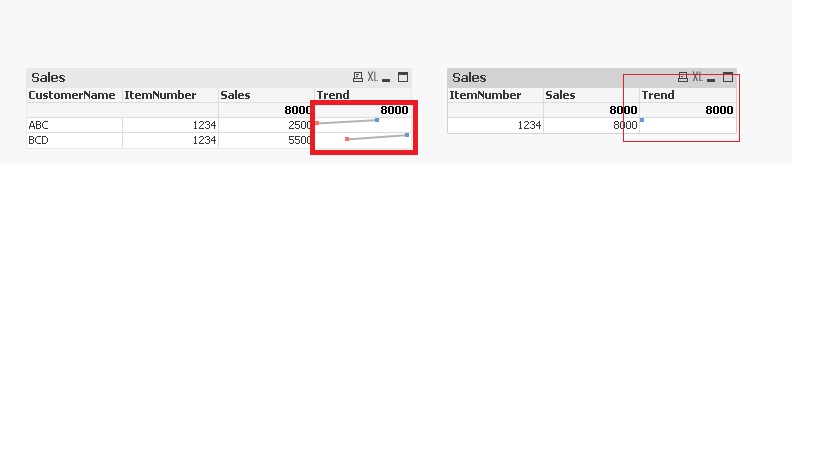
Displaying the Sum of Value for Unique Item Number, we used AGGR function.
Sum(Aggr(Sum(Sales), ItemNumber))
Now i have a expression, Trend, [A minichart where i have to Display the Sales Value with DateValue.(which shows lowervalue & higher value in Red & Blue color respectively)
But now in the item number[Second Chart], i have only one row which is the Aggr Sum of the Sales Value.

Can you please suggest me how to display the Trend chart [MiniChart] to display like the first chart [Distributor]
Thanks in Advance.
Sasi
- Mark as New
- Bookmark
- Subscribe
- Mute
- Subscribe to RSS Feed
- Permalink
- Report Inappropriate Content
Don't have the sample to play around with it, but try this:
Min(Aggr(Sum(Sales), ItemNumber, Distributor)) and
Max(Aggr(Sum(Sales), ItemNumber, Distributor))
It would be helpful if you can share a sample.
- Mark as New
- Bookmark
- Subscribe
- Mute
- Subscribe to RSS Feed
- Permalink
- Report Inappropriate Content
Hello Sunny,
Thanks a lot.
Please find enclosed, the sample file.
The output of the second chart should be in single line only but the Trend should look like the first chart.
Thanks,
Sasi
- Mark as New
- Bookmark
- Subscribe
- Mute
- Subscribe to RSS Feed
- Permalink
- Report Inappropriate Content
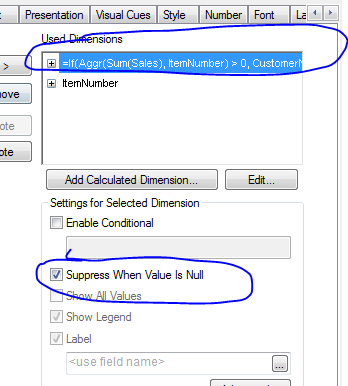
This?
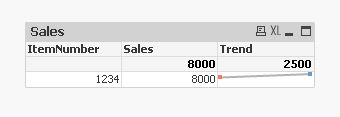
Used ItemNumber and a calculated dimension (=If(Aggr(Sum(Sales), ItemNumber) > 0, CustomerName)) and select 'Suppress When Value Is Null' for the calculated dimension.
Expressions stay the same:
1) Sum(Aggr(Sum(Sales), ItemNumber))
2) Sum(Sales)
- « Previous Replies
-
- 1
- 2
- Next Replies »