Unlock a world of possibilities! Login now and discover the exclusive benefits awaiting you.
- Qlik Community
- :
- All Forums
- :
- QlikView App Dev
- :
- Displaying top 5 results for a survey question wit...
- Subscribe to RSS Feed
- Mark Topic as New
- Mark Topic as Read
- Float this Topic for Current User
- Bookmark
- Subscribe
- Mute
- Printer Friendly Page
- Mark as New
- Bookmark
- Subscribe
- Mute
- Subscribe to RSS Feed
- Permalink
- Report Inappropriate Content
Displaying top 5 results for a survey question with percentage of answers given
We are conduction a survey by country and in the last section the participant is asked to select an issue (question) out of the possible 22 questions and suggest a solution for it - one of the possible 12 solutions.
Find a sample data in the attached file: rawData.txt
The below tables are based on the attached data.
Where in addition to the country and UniqueID fields we have
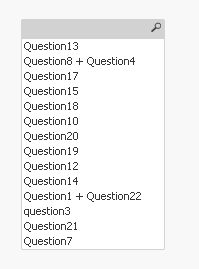
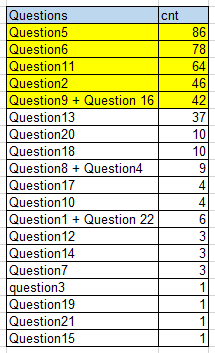
- Questions: Containing the possible 1 to 22 questions selected
- Solution: containing 1 to 12 possible solutions suggested
The requested report should look like this:
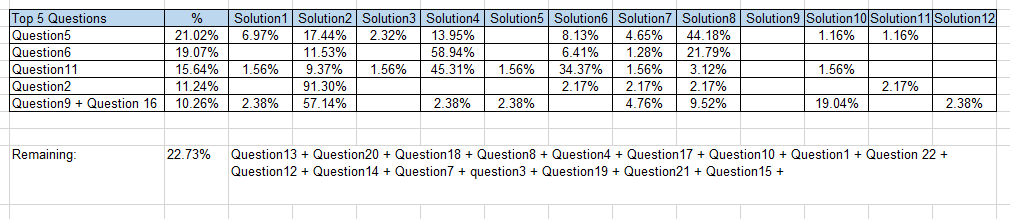
The first column represents the result of the most top 5 selected questions and the second column represents their percentages.
The results of the following questions should be considered together.
- Question9 and Question 16
- Question 4 and question8
- Question 1 and question22
The columns Solution1 to Solution12 should indicate the % of the selected solution for the given question.
Below the table (in a textbox) I want to display the remaining percentage of the question (excluding the 5 selected in the table) and the name of the questions concatenated.
Thank you for any hints and guidance
Take care all
Accepted Solutions
- Mark as New
- Bookmark
- Subscribe
- Mute
- Subscribe to RSS Feed
- Permalink
- Report Inappropriate Content
- Mark as New
- Bookmark
- Subscribe
- Mute
- Subscribe to RSS Feed
- Permalink
- Report Inappropriate Content
Like this

- Mark as New
- Bookmark
- Subscribe
- Mute
- Subscribe to RSS Feed
- Permalink
- Report Inappropriate Content
Thank you so much
How can i display the list of Questions in the Remaining group in a text object?
thank you again
- Mark as New
- Bookmark
- Subscribe
- Mute
- Subscribe to RSS Feed
- Permalink
- Report Inappropriate Content
May be use this
=Aggr(If(Rank(Count({1}UniqueID)) < 6, Null(), Only({1}Questions_New)), Questions_New)