Unlock a world of possibilities! Login now and discover the exclusive benefits awaiting you.
- Qlik Community
- :
- All Forums
- :
- QlikView App Dev
- :
- Displaying two dimension as one in a chart
- Subscribe to RSS Feed
- Mark Topic as New
- Mark Topic as Read
- Float this Topic for Current User
- Bookmark
- Subscribe
- Mute
- Printer Friendly Page
- Mark as New
- Bookmark
- Subscribe
- Mute
- Subscribe to RSS Feed
- Permalink
- Report Inappropriate Content
Displaying two dimension as one in a chart
Hello,
I have a specific requirement but do not know how to solve it. Please see first the two screenshots I attached.
I have a data table as described in Screenshot 1. I have two Budget values and a date value. The budget value is referencing on the "Date Budget" column. Also I have in the same row a Prognosis value and a "Date Prognosis" column.
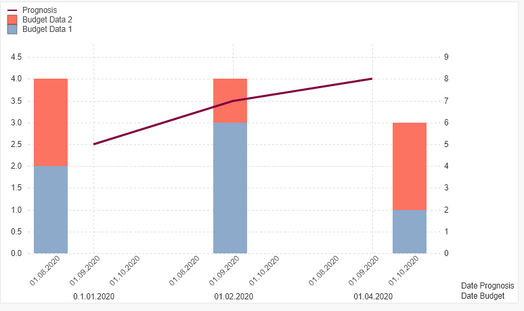
How can i show the variables in a single chart? On the x-axis I want to show the date, and on the y-axis the values (see Screenshot 2). The problem is, I dont know how I can reference to "Date Budget" for the Budget values on the x-axis and to "Date Prognosis" for the prognosis values also on the same x-axis.
Is there a solution to this requirement? Would appreciate some insights or help.
Kind Regards
Accepted Solutions
- Mark as New
- Bookmark
- Subscribe
- Mute
- Subscribe to RSS Feed
- Permalink
- Report Inappropriate Content
Hey,
I did it different as basavaraju suggested, as I only wanted one dimension, not two.
Basically I used a synthetic dimension:
=ValueList('01.01.2020', '01.02.2020', '01.03.2020', '01.04.2020', 01.05.2020','01.06.2020','01.07.2020','01.08.2020','01.09.2020','01.10.2020','01.11.2020','01.12.2020')
And as expression I used the following:
sum(if(ValueList('01.01.2020', '01.02.2020', '01.03.2020', '01.04.2020', 01.05.2020','01.06.2020','01.07.2020','01.08.2020','01.09.2020','01.10.2020','01.11.2020','01.12.2020') = date_budget, budget_data_1, 0 ))
This should work if the date is formatted the right way. If not, try this:
sum(if(ValueList('01.01.2020', '01.02.2020', '01.03.2020', '01.04.2020', 01.05.2020','01.06.2020','01.07.2020','01.08.2020','01.09.2020','01.10.2020','01.11.2020','01.12.2020') = MakeDate(year(date_budget), month(date_budget), day(date_budget)), budget_data_1, 0 ))
With this, you can display two different dimensions as one.
Let me know if it works,
Regards
- Mark as New
- Bookmark
- Subscribe
- Mute
- Subscribe to RSS Feed
- Permalink
- Report Inappropriate Content
Hi,
Check this out, are you looking for something like this:
You can show two dimensions in the x axis.
cheers,
Basav
- Mark as New
- Bookmark
- Subscribe
- Mute
- Subscribe to RSS Feed
- Permalink
- Report Inappropriate Content
Hello,
How did you do that? It's exactly what I'm looking for too
Thanks,
- Mark as New
- Bookmark
- Subscribe
- Mute
- Subscribe to RSS Feed
- Permalink
- Report Inappropriate Content
Hey,
I did it different as basavaraju suggested, as I only wanted one dimension, not two.
Basically I used a synthetic dimension:
=ValueList('01.01.2020', '01.02.2020', '01.03.2020', '01.04.2020', 01.05.2020','01.06.2020','01.07.2020','01.08.2020','01.09.2020','01.10.2020','01.11.2020','01.12.2020')
And as expression I used the following:
sum(if(ValueList('01.01.2020', '01.02.2020', '01.03.2020', '01.04.2020', 01.05.2020','01.06.2020','01.07.2020','01.08.2020','01.09.2020','01.10.2020','01.11.2020','01.12.2020') = date_budget, budget_data_1, 0 ))
This should work if the date is formatted the right way. If not, try this:
sum(if(ValueList('01.01.2020', '01.02.2020', '01.03.2020', '01.04.2020', 01.05.2020','01.06.2020','01.07.2020','01.08.2020','01.09.2020','01.10.2020','01.11.2020','01.12.2020') = MakeDate(year(date_budget), month(date_budget), day(date_budget)), budget_data_1, 0 ))
With this, you can display two different dimensions as one.
Let me know if it works,
Regards
- Mark as New
- Bookmark
- Subscribe
- Mute
- Subscribe to RSS Feed
- Permalink
- Report Inappropriate Content
See the attached QVW file.
Does anybody know, how I can now format the displayed x-axis?
I want the format of the x-axia be: 'Jan 2020", 'Feb 2020' and so on instead of '01.01.2020' and '01.02.2020'.
