Unlock a world of possibilities! Login now and discover the exclusive benefits awaiting you.
- Qlik Community
- :
- All Forums
- :
- QlikView App Dev
- :
- Re: Dividing a cell by other cells in a table in Q...
- Subscribe to RSS Feed
- Mark Topic as New
- Mark Topic as Read
- Float this Topic for Current User
- Bookmark
- Subscribe
- Mute
- Printer Friendly Page
- Mark as New
- Bookmark
- Subscribe
- Mute
- Subscribe to RSS Feed
- Permalink
- Report Inappropriate Content
Dividing a cell by other cells in a table in Qlikview
Hi All,
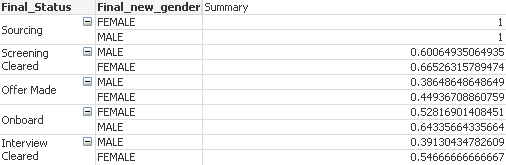
I am trying to calculate the % in my table.
My table looks like below
| Final_Status | Final_new_gender | Count |
| Sourcing | FEMALE | 159 |
| Sourcing | MALE | 246 |
| Screening Cleared | FEMALE | 174 |
| Screening Cleared | MALE | 227 |
| Offer Made | FEMALE | 67 |
| Offer Made | MALE | 51 |
| Onboard | FEMALE | 34 |
| Onboard | MALE | 56 |
| Interview Cleared | FEMALE | 41 |
| Interview Cleared | MALE | 36 |
The % field needs to be calculated which will be different for both Male and female. It's bit tricky to write how this field is calculated ,so I have attached the sample file.
Any help will be appreciated.
Thanks
- Mark as New
- Bookmark
- Subscribe
- Mute
- Subscribe to RSS Feed
- Permalink
- Report Inappropriate Content
 Hi
Hi
is this?
Test:
load *, if(Final_new_gender='MALE',0,1) as Gender;
LOAD * INLINE [
Final_Status, Final_new_gender, Count
Sourcing, FEMALE, 159
Sourcing, MALE, 246
Screening Cleared, FEMALE, 174
Screening Cleared, MALE, 227
Offer Made, FEMALE, 67
Offer Made, MALE, 51
Onboard, FEMALE, 34
Onboard, MALE, 56
Interview Cleared, FEMALE, 41
Interview Cleared, MALE, 36
];
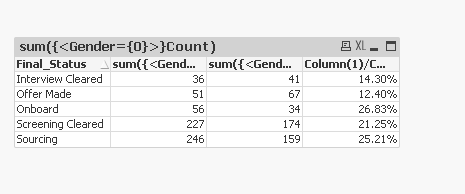
Strighttable:
Dim: Final status
Exp1;sum({<Gender={0}>}Count)
Exp2:sum({<Gender={1}>}Count)
Exp3: column(2)/Column(1) [check relative]
- Mark as New
- Bookmark
- Subscribe
- Mute
- Subscribe to RSS Feed
- Permalink
- Report Inappropriate Content
Hi,
This is not how I wanted.The table should come exactly as I have shown in excel file attached. '%' is the new column which needs to be added in the table.
- Mark as New
- Bookmark
- Subscribe
- Mute
- Subscribe to RSS Feed
- Permalink
- Report Inappropriate Content
may be this?
- Mark as New
- Bookmark
- Subscribe
- Mute
- Subscribe to RSS Feed
- Permalink
- Report Inappropriate Content
Hi,
Sorry this is not what I was looking for. If you look at the file and see the '%' field calculation , I have to get those numbers and table should look exactly the same as in excel.
- Mark as New
- Bookmark
- Subscribe
- Mute
- Subscribe to RSS Feed
- Permalink
- Report Inappropriate Content
Hi,
You could use range sum. Divide the table out for Female and male (since the range sum doesn't work as expected with two dimensions) and use the below formulae
Numerator :
SUM(TOTAL {<Final_new_gender={'FEMALE'}>}Count) - RANGESUM(ABOVE(SUM({<Final_new_gender={'FEMALE'}>}Count),1,ROWNO()))
Denominator :
SUM(TOTAL {<Final_new_gender={'FEMALE'}>}Count) - RANGESUM(ABOVE(SUM({<Final_new_gender={'FEMALE'}>}Count),2,ROWNO()))
Note:
- Order the table on the load order (or you could associate each status with a priority and order by that)
- Add a clause to not calculate when status is "Sourcing"
Hope this helps
- Mark as New
- Bookmark
- Subscribe
- Mute
- Subscribe to RSS Feed
- Permalink
- Report Inappropriate Content
Hi Anagha,
Could you please share a sample QVW. I tried your way but it didn't work out.
- Mark as New
- Bookmark
- Subscribe
- Mute
- Subscribe to RSS Feed
- Permalink
- Report Inappropriate Content
Hi, i cannot share anything .. I'm at office 
Can you share your QVW so that i can look into whats wrong
- Mark as New
- Bookmark
- Subscribe
- Mute
- Subscribe to RSS Feed
- Permalink
- Report Inappropriate Content
Load the excel into QV and try the below
Dimension:
Final_Status , Final_new_gender (as named in the excel )
Expression:
(PICK( WildMatch(Final_new_gender,'*FEMALE*','*MALE*') , rangesum(below(total sum({<Final_new_gender={'FEMALE'}>}Count),0,100)) ,
rangesum(below(total sum({<Final_new_gender={'MALE'}>}Count),0,100))) /
(
PICK( WildMatch(Final_new_gender,'*FEMALE*','*MALE*') ,sum( total<Final_Status> aggr(above(total sum({<Final_new_gender={'FEMALE'}>}Count)),Final_Status)),
sum( total<Final_Status> aggr(above(total sum({<Final_new_gender={'MALE'}>}Count)),Final_Status))) +
PICK( WildMatch(Final_new_gender,'*FEMALE*','*MALE*') , rangesum(below(total sum({<Final_new_gender={'FEMALE'}>}Count),0,100)) ,
rangesum(below(total sum({<Final_new_gender={'MALE'}>}Count),0,100)))
)
)