Unlock a world of possibilities! Login now and discover the exclusive benefits awaiting you.
- Qlik Community
- :
- All Forums
- :
- QlikView App Dev
- :
- Doubt on dates with values in graphic (Dúvida sobr...
- Subscribe to RSS Feed
- Mark Topic as New
- Mark Topic as Read
- Float this Topic for Current User
- Bookmark
- Subscribe
- Mute
- Printer Friendly Page
- Mark as New
- Bookmark
- Subscribe
- Mute
- Subscribe to RSS Feed
- Permalink
- Report Inappropriate Content
Doubt on dates with values in graphic (Dúvida sobre datas com valores em gráfico)
Hello, I am new to QlikView.
I'm trying to implement QlikView in the company to assist in the reports.
I have given a good searched in forums but have not found something that freak out the effect I want.
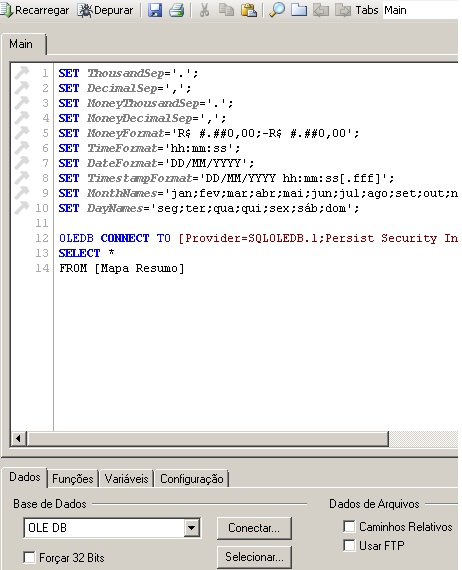
What I did was load a table in the company database: Edit Script - OLE DB - Connect - Microsoft OLE DB Provider for SQL Server - Next - selected the server and the database.
result:
Then select the table sent Map Overview and it contained several columns.
What I want now is to create a graphic that links two columns be a "time of sale" and the other "values".
example;
| Data da Venda | Valores |
|---|---|
| 01/02/2015 | R$ 5000,00 |
| 02/02/2015 | R$ 7000,00 |
| 03/02/2015 | R$ 8000,00 |
| 01/03/2015 | R$ 4000,00 |
| 02/03/2015 | R$ 6000,00 |
| 03/03/2015 | R$ 5000,00 |
Must appear in the graph the total months of February and I can select the sea month
Translated with Google Translate - Qlik Community Administrative Team
Olá, sou iniciante no Qlikview.
Estou tentando implementar o Qlikview na empresa para auxiliar nos relatórios.
Já dei uma boa pesquisada em fóruns, mas não encontrei algo que surta o efeito que desejo.
O que fiz foi carregar uma tabela do banco de dados da empresa: Editar Script - OLE DB - Conectar - Microsoft OLE DB Provider for SQL Server - Avançar - selecionei o servidor e o banco de dados.
Resultado:
(Image)
Depois mandei selecionar a tabela Mapa Resumo e nela constam varias colunas.
O que eu quero agora é criar um grafico que relacione 2 colunas sendo uma "data da venda" e a outra "valores".
Exemplo;
(Image)
Preciso que apareça no grafico o total do mes de fevereiro e que eu possa selecionar o mes de mar
- Tags:
- new_to_qlikview