Unlock a world of possibilities! Login now and discover the exclusive benefits awaiting you.
- Qlik Community
- :
- All Forums
- :
- QlikView App Dev
- :
- Re: Drill Down Group without using Aggregation Fun...
- Subscribe to RSS Feed
- Mark Topic as New
- Mark Topic as Read
- Float this Topic for Current User
- Bookmark
- Subscribe
- Mute
- Printer Friendly Page
- Mark as New
- Bookmark
- Subscribe
- Mute
- Subscribe to RSS Feed
- Permalink
- Report Inappropriate Content
Drill Down Group without using Aggregation Functions?
Hello Everyone!
I'm new to Qlikview and I'm trying to create a drill down bar chart.
My data has a hierarchy.
Each person has an overall score.
Overall Score has 5 score areas.
Each score area has many scores.
and finally each score has multiple indicators.
.png)
I have set up a table with the following columns:
Person Name, Area Name, Score Name, Indicator Name.
Overall scores are visualized in a different chart. Drill down is from Score area onwards.
This allows me to create a drill down group. But I am having trouble displaying the correct values.
The values for these fields are calculated by a model outside of qlikview, and common aggregation functions like sum or Avg do not portray accurate information. I already have the values for the Score Area, Scores and Indicators in separate columns. How do I visualize the score area value for the score area, and when i drill down, the score value for the score, and indicator values for the indicators.
When i click on one person in the list box,The visualization I want should show the score areas and their values, clicking on a score area should show the scores and so on.
I have the drill down group in place. But need tips and pointers on how to visualize the correct information.
Any tips on how to structure the data file and also build the visualization are welcome.
I have a personal license for Qlikview, so I wont be able to open any attached qlikview files.
- Mark as New
- Bookmark
- Subscribe
- Mute
- Subscribe to RSS Feed
- Permalink
- Report Inappropriate Content
First you can create a drill down for your data.
like this:
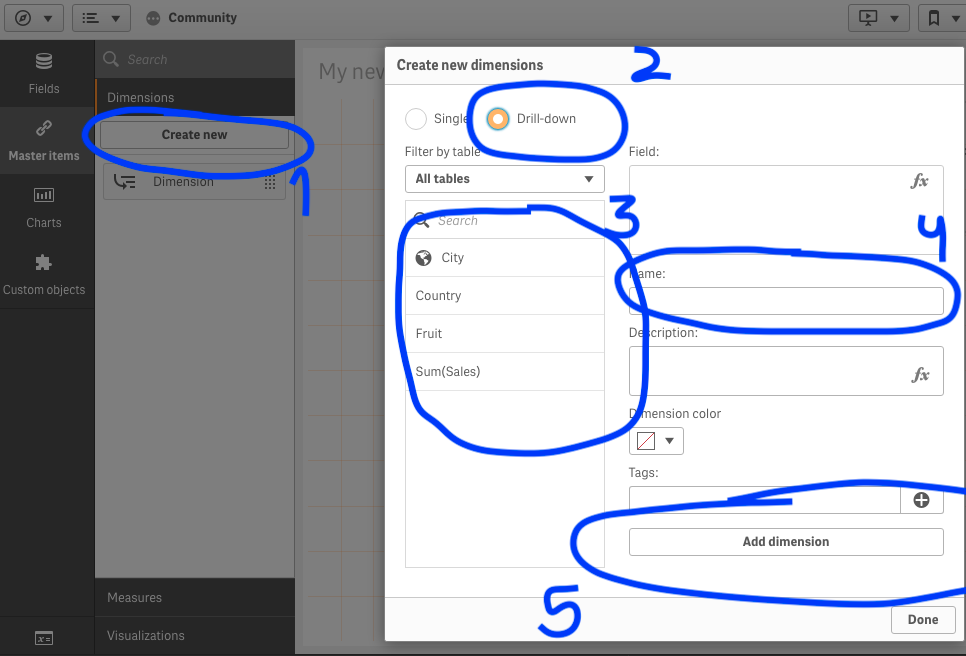
on step 3:
Select the columns that will have the drill-down but in the right order! you choose here what comes first.
In a chart if you want to display the values, go to appearance, and find the checkbox that will display the values.
in the datafile structure i did not understand well what did you mean.
If you need any more help let me know!
Thanks
- Mark as New
- Bookmark
- Subscribe
- Mute
- Subscribe to RSS Feed
- Permalink
- Report Inappropriate Content
sorry, i posted a print from Qlik Sense, but qlik view has this features too. I think you can go from there.
Good lock and sorry for the misplaced print screen.
- Mark as New
- Bookmark
- Subscribe
- Mute
- Subscribe to RSS Feed
- Permalink
- Report Inappropriate Content
Hi Felipe,
Unfortunately, I am using Qlikview and not Qliksense.
I know how to make a drill down group.
My issue is with how the expression for the drill down group is being displayed.
Usually we use aggregation functions like Sum or Avg to combine the expression (ex: sales) over the different levels of the drill down.
But, in my case, I do not want to use Aggregation functions, since I am already using the data I received from an external application. This application calculates the value for each level (Ex: it already uses the values of different scores and provides me with the value for Score Area).
See image below.
This is the data structure for one person. Values are exported to excel and that excel file is being used in qlikview.
I have restructured the excel file as I mentioned in my question to allow the use of the drill down feature.
.png)
How do I structure my data file such that I can perform the drill down but still display the individual values without aggregation?
so my bar chart will look like this...
Area 1 (80)
Area 2 (70)
Area 3 (50)
Area 4 (40)
Area 5 (100)
If i click on Area 5, it will show me
Score 17 (50)
Score 18 (85)
If I click on Score 17, it will show me
Indicator 1 (20)
Indicator 2 (90)
(Notice how the values are already provided, and cannot be calculated by aggregation functions...)
- Mark as New
- Bookmark
- Subscribe
- Mute
- Subscribe to RSS Feed
- Permalink
- Report Inappropriate Content
I get it now, but i don't think it is possible to do something like this.
The drill-down will aways try to aggregate the smallest dimension to the one you selected. So, it won't work for you.
But maybe someone knows more.
Good luck
- Mark as New
- Bookmark
- Subscribe
- Mute
- Subscribe to RSS Feed
- Permalink
- Report Inappropriate Content
Check the GetCurrentField() function https://help.qlik.com/en-US/qlikview/12.1/Subsystems/Client/Content/ChartFunctions/FieldFunctions/ge...
Maybe that combined with nested ifs will give you the result you want.
If you send a sample qvw I can try to solve it 
Regards!