Unlock a world of possibilities! Login now and discover the exclusive benefits awaiting you.
- Qlik Community
- :
- All Forums
- :
- QlikView App Dev
- :
- Drilling down and stack in a bar chart based on co...
- Subscribe to RSS Feed
- Mark Topic as New
- Mark Topic as Read
- Float this Topic for Current User
- Bookmark
- Subscribe
- Mute
- Printer Friendly Page
- Mark as New
- Bookmark
- Subscribe
- Mute
- Subscribe to RSS Feed
- Permalink
- Report Inappropriate Content
Drilling down and stack in a bar chart based on columns
I have a Bar chart, which is made from 3 columns. The columns are being fetched from two db tables that are connected using ODBC.
Now in the dimensions I have the similar field in both the tables that is sku. Kindly see the screenshots for better understanding
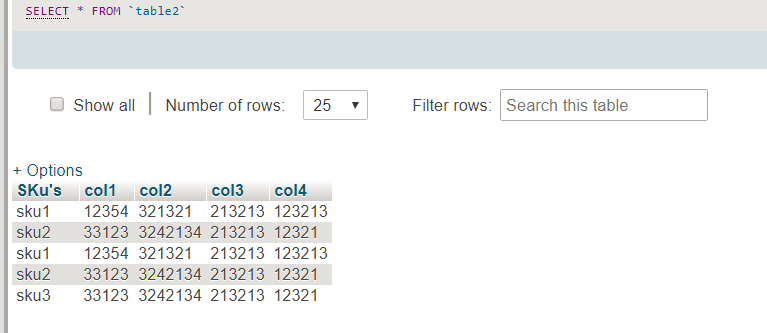
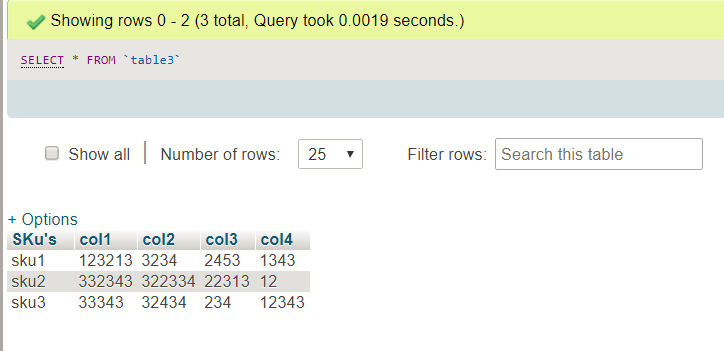
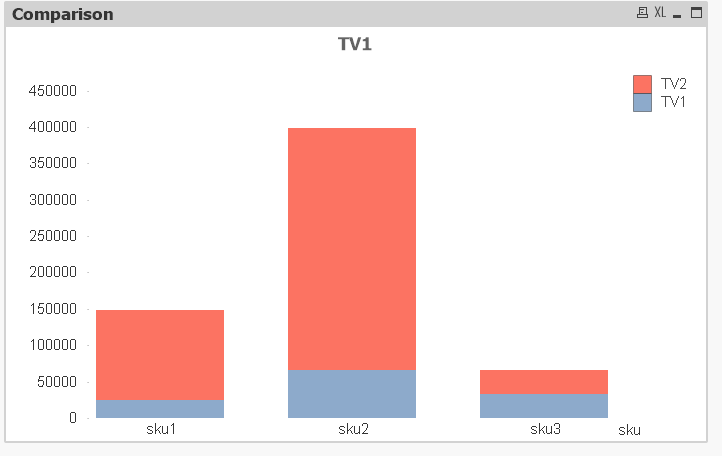
Now the problem is that I want the comparison between TV1 and TV2 and the SKu's of both as stacks. Also The moment some person clicks on the sku1 it should drill down into remotes . Please help
- Mark as New
- Bookmark
- Subscribe
- Mute
- Subscribe to RSS Feed
- Permalink
- Report Inappropriate Content
Hi,
did you try to do it and it is not working or you don't know how to do it ?
can you share the expressions used ? or can you you share a QVW test ?
- Mark as New
- Bookmark
- Subscribe
- Mute
- Subscribe to RSS Feed
- Permalink
- Report Inappropriate Content
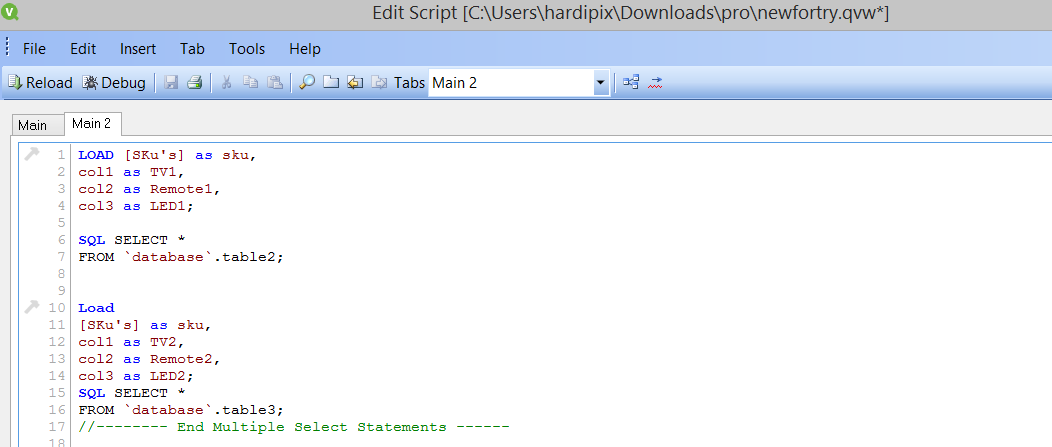
I tried quite a lot of things, I don't have license so that is why I didn't share it. Also I'm new to qlikview so I'm not sure if i'm going the right way. The Dimensions are Sku, and the expressions are sum(TV1) and Sum(TV2). It tried grouping in the edit group option and then adding it but it was throwing all the data at once, rather than giving me a chance to click and make selection.
- Mark as New
- Bookmark
- Subscribe
- Mute
- Subscribe to RSS Feed
- Permalink
- Report Inappropriate Content
If you create you QVW with the "Personal Edition"-license others that do have a license can still open the file. So do share it...
You might consider to model your data a little bit further.
But with the datamodel at hand...
In order for the graph to drill into the data you must define it.
It is in a diffrent column and thus need a diffrent expression...
So add two more expressions. One for Remote1 and one for Remote2.
Then in the conditional expression, only show TV expressions when possibe Sku's are > 1 and show Remote expressions when possible Sku's = 1...
Br
Hans
- Mark as New
- Bookmark
- Subscribe
- Mute
- Subscribe to RSS Feed
- Permalink
- Report Inappropriate Content
Hi,
find attached.
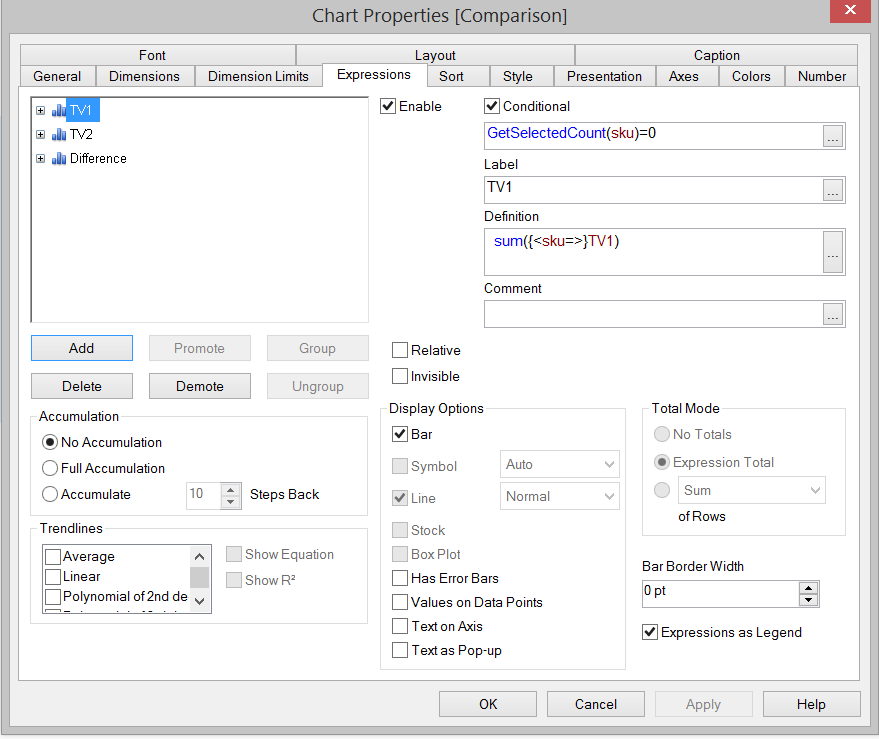
here is the expressions i used for the first view (TV):
=sum({<sku=>}TV1) => TV1
=sum({<sku=>}TV2) => TV2
=sum({<sku=>}TV2)-sum({<sku=>}TV1) => difference
on each of these expressions, enable conditional display and put this:
GetSelectedCount(sku)=0
here is the expressions i used for the first view (Remote):
=sum({<sku=>}Remote1) => Remote1
=sum({<sku=>}Remote2) => Remote2
=sum({<sku=>}Remote1)-sum({<sku=>}Remote2) => difference
on each of these expressions, enable conditional display and put this:
GetSelectedCount(sku)<>0
add a filter object SKU and try choosing an SKU, you will see that as soon as you choose one, the bar charts move to the Remote View.
if you can't open the app, you can download file 1 and 2, it is your data.
juste create the object and use everything I described above.
- Mark as New
- Bookmark
- Subscribe
- Mute
- Subscribe to RSS Feed
- Permalink
- Report Inappropriate Content
It partially worked, I still didn't get the TV comparison, but had them stacked over one another. 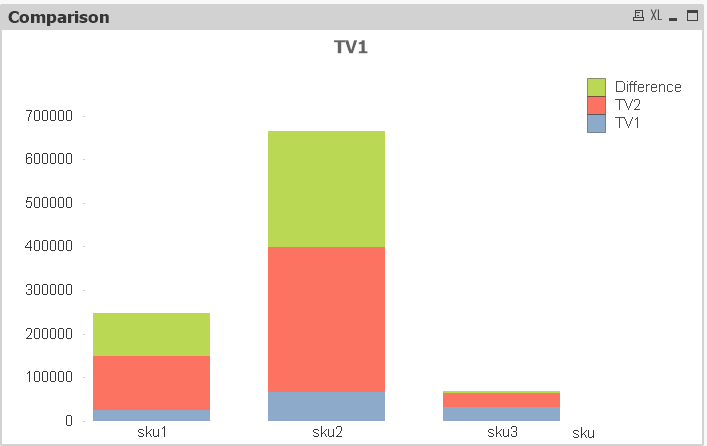
I didn't try for remote, because just the TV part is not working. Could you please check, and let me know where I'm going wrong
- Mark as New
- Bookmark
- Subscribe
- Mute
- Subscribe to RSS Feed
- Permalink
- Report Inappropriate Content
Could you explain model your data part. I didn't understand what you meant there. Also, could you tell me how to upload the qvw file. And could you elaborate a bit on the expressions part a bit more.
- Mark as New
- Bookmark
- Subscribe
- Mute
- Subscribe to RSS Feed
- Permalink
- Report Inappropriate Content
I thought you need the difference as a third stacked measure...
what do you need for the differences ??
- Mark as New
- Bookmark
- Subscribe
- Mute
- Subscribe to RSS Feed
- Permalink
- Report Inappropriate Content
Actually I meant a side by side comparison of TV1 and TV2 where in the stacks sku1, sku2, sku3 should appear rather than TV1 and TV2. Hopefully this clears out the confusion