Unlock a world of possibilities! Login now and discover the exclusive benefits awaiting you.
- Qlik Community
- :
- All Forums
- :
- QlikView App Dev
- :
- Dynamic Bubble Size in Scatter Chart
Options
- Subscribe to RSS Feed
- Mark Topic as New
- Mark Topic as Read
- Float this Topic for Current User
- Bookmark
- Subscribe
- Mute
- Printer Friendly Page
Turn on suggestions
Auto-suggest helps you quickly narrow down your search results by suggesting possible matches as you type.
Showing results for
Not applicable
2014-07-02
10:11 PM
- Mark as New
- Bookmark
- Subscribe
- Mute
- Subscribe to RSS Feed
- Permalink
- Report Inappropriate Content
Dynamic Bubble Size in Scatter Chart
Hello,
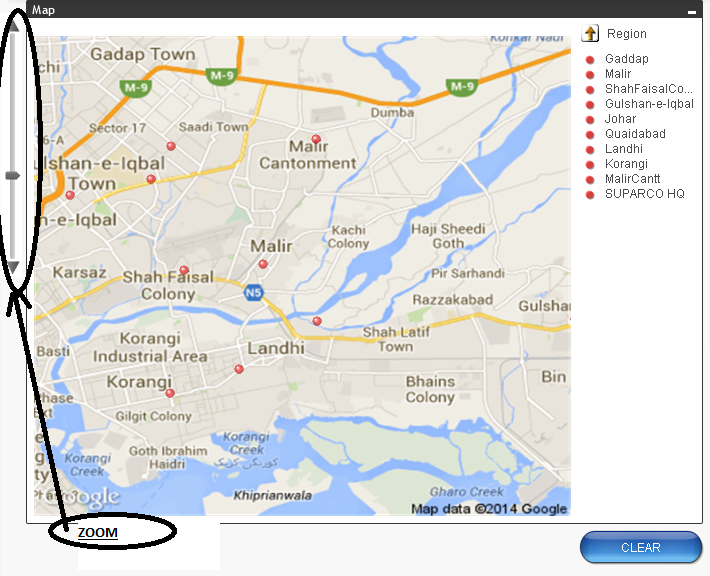
I have the following map on my application as a Scatter Chart, with a longitude and a latitude (please see QVW attached).
There's also a Zoom on the left (with a Slider using a variable var_zoom) that allows me to make a zoom over the map to see it closer:
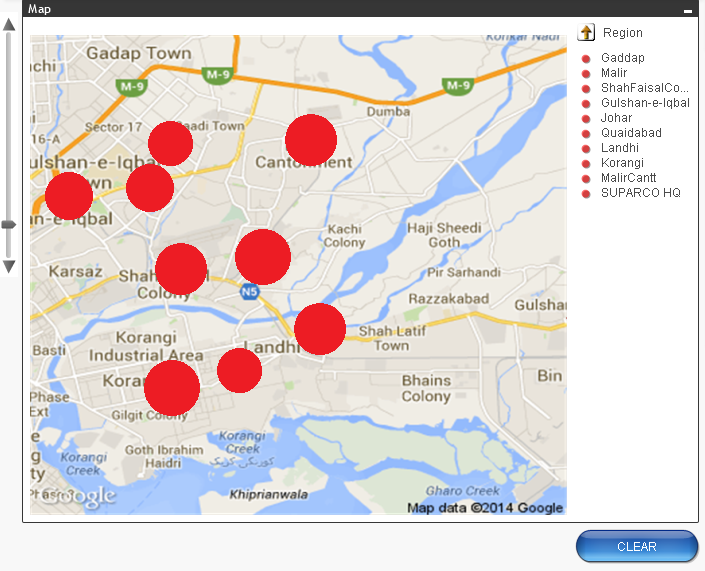
What I want is that if I make zoom in the Slider, I'd see the size of the bubbles bigger like this:
Is there any way to do this?
I'd really appreciate it.
Thanks.
- Tags:
- new_to_qlikview
350 Views
0 Replies