Unlock a world of possibilities! Login now and discover the exclusive benefits awaiting you.
- Qlik Community
- :
- All Forums
- :
- QlikView App Dev
- :
- Dynamic Dimension in a chart
- Subscribe to RSS Feed
- Mark Topic as New
- Mark Topic as Read
- Float this Topic for Current User
- Bookmark
- Subscribe
- Mute
- Printer Friendly Page
- Mark as New
- Bookmark
- Subscribe
- Mute
- Subscribe to RSS Feed
- Permalink
- Report Inappropriate Content
Dynamic Dimension in a chart
Hi,
I have some data, which are stored in the following manner.
Customer ID | Product | Start | End |
123 | z | 01-01-2013 | 01-12-2013 |
134 | x | 01-02-2012 | 01-11-2013 |
231 | y | 01-05-2013 | 01-06-2013 |
213 | z | 01-02-2012 | 05-02-2013 |
267 | z | 02-08-2012 | 01-12-2013 |
303 | x | 03-02-2012 | 01-11-2013 |
340 | y | 04-05-2012 | 01-06-2013 |
377 | z | 05-02-2012 | 05-11-2013 |
413 | z | 06-02-2012 | 06-10-2013 |
450 | x | 07-05-2012 | 07-12-2013 |
487 | y | 08-10-2012 | 08-12-2013 |
523 | z | 09-11-2012 | 09-01-2013 |
560 | z | 10-09-2012 | 10-02-2013 |
597 | x | 11-05-2012 | 11-03-2013 |
634 | y | 12-03-2012 | 12-07-2013 |
670 | z | 13-01-2012 | 13-12-2013 |
I wouldlike to make a chart that counts the number of customers active on each product in a given period of time.
Preferably the chart should look something like this:
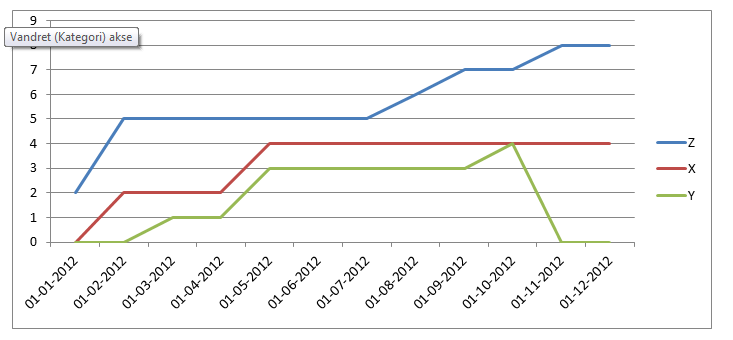
The chart displays, that there are 4 active customers on product X in June 2012, 5
active customer on product Z and so on.
The x-axis should be dynamic, i.e. the user specifies a date in an input box. Then the chart is generated using this data and it adds one month until 12 months have been analyzed. In the chart above the data 01-01-2012 has been used.
Does anybody have a good idea how to make this? Or do you need further information?.
Br Martin
- Tags:
- new_to_qlikview
- Mark as New
- Bookmark
- Subscribe
- Mute
- Subscribe to RSS Feed
- Permalink
- Report Inappropriate Content
Here is an updated doc with your date format. I am used to M-D-YYYY not D-M-YYYY, sorry about that!
- Mark as New
- Bookmark
- Subscribe
- Mute
- Subscribe to RSS Feed
- Permalink
- Report Inappropriate Content
Hi Rebecca,
Thanks alot for the document. The document works on perfectly on the data I have provided.
I think there will be a problems with the solution proposed if i had to use it on our production data.
The amount of data in the reference table will be very large due to the amount of customers and some of the span a period of 15 years. So do you have an idea for an alternative method?
I am also missing the input box where the user should specify the start date of the analysis, which should also work as the start date in the chart?
Thanks in advance.
- Mark as New
- Bookmark
- Subscribe
- Mute
- Subscribe to RSS Feed
- Permalink
- Report Inappropriate Content
Attached is an example of a calendar object to select the start date. I am not sure about an alternative method if you have such a large data set though... maybe someone else on here has an idea?