Unlock a world of possibilities! Login now and discover the exclusive benefits awaiting you.
- Qlik Community
- :
- All Forums
- :
- QlikView App Dev
- :
- Dynamic calculation for past months data
- Subscribe to RSS Feed
- Mark Topic as New
- Mark Topic as Read
- Float this Topic for Current User
- Bookmark
- Subscribe
- Mute
- Printer Friendly Page
- Mark as New
- Bookmark
- Subscribe
- Mute
- Subscribe to RSS Feed
- Permalink
- Report Inappropriate Content
Dynamic calculation for past months data
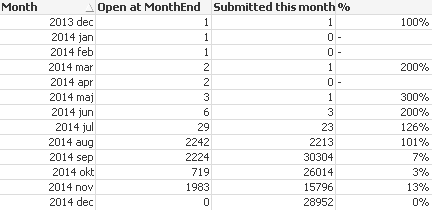
I want to calculate the percentage of tickets that are open at the end of every month.
Formula is : % open = count of tickets open at end of month/count of tickets submitted in that month.
BUT the challenge arises when the tickets are resolved and I want to show the open tickets for older months.
For instance if I were to look/calculate for a particular month in the past now, say November 2014;
I will count all the tickets with "Submit Date" < November but with Resolved Date > November,2014 or empty (ie. still open in February). Once I get this I can divide this by the count of tickets submitted in November to get the percentage I'm looking for.
Fields are :
- SubmitDate
- ResolvedDate (will be empty for still open tickets)
- IncidentID
Could someone please help me set this expression on my chart?
Best Regards,
Tony
Accepted Solutions
- Mark as New
- Bookmark
- Subscribe
- Mute
- Subscribe to RSS Feed
- Permalink
- Report Inappropriate Content
You need to replace a blank [Last Resolved Date] with Today() in some of the expressions. I would do the following (but I cannot test it since I don't have source data, so beware of bugs...) This way, also incidents that are still open will have an end date for the range: Today.
Leave the first table as it is. Change the second table to:
Months:
Load
MonthEnd(AddMonths(MonthStart([Submit Date]),IterNo()-1)) < RangeMin( Today() +1, [Last Resolved Date] ) as Open,
IterNo() = 1 as IsSubmissionMonth,
Date(AddMonths(MonthStart([Submit Date]),IterNo()-1),'YYYY MMM') as Month,
[Incident Number]
Resident Incidents
While MonthEnd(AddMonths(MonthStart([Submit Date]),IterNo()-1)) <= RangeMin( Today(), MonthEnd([Last Resolved Date]) ) ;
HIC
- Mark as New
- Bookmark
- Subscribe
- Mute
- Subscribe to RSS Feed
- Permalink
- Report Inappropriate Content
Could you attached your file?
Excel or qvq
- Mark as New
- Bookmark
- Subscribe
- Mute
- Subscribe to RSS Feed
- Permalink
- Report Inappropriate Content
Hi Robert,
Thanks for the reply. Please find attached file as requested, I have added only the relevant fields to cut down on the size.
Also I'm including the expected chart as i make in Excel for your reference please.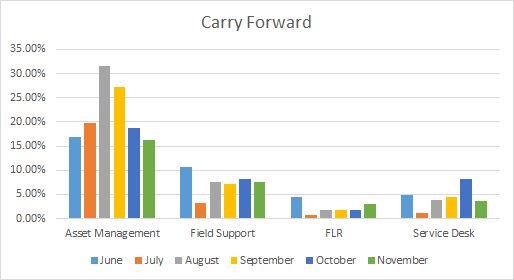
Hoping to hear on your solution.
Best Regards,
Tony
- Mark as New
- Bookmark
- Subscribe
- Mute
- Subscribe to RSS Feed
- Permalink
- Report Inappropriate Content
I would solve this in the data model, by generating all months between the submission and the resolution.
Incidents:
LOAD
[Submit Date],
[Last Resolved Date],
Floor([Last Resolved Date] - [Submit Date]) as DaysOpen,
[Service Line],
[Incident Number]
FROM [Raw_Sample_for QV Blog v4.xlsx] (ooxml, embedded labels, table is Sheet3);
Months: // Months between the submit date and resolved date
Load
MonthEnd(AddMonths(MonthStart([Submit Date]),IterNo()-1)) < [Last Resolved Date] as Open,
IterNo() = 1 as IsSubmissionMonth,
Date(AddMonths(MonthStart([Submit Date]),IterNo()-1),'YYYY MMM') as Month,
[Incident Number]
Resident Incidents
While MonthEnd(AddMonths(MonthStart([Submit Date]),IterNo()-1)) <= MonthEnd([Last Resolved Date]) ;
With the above script, you can use Month as dimension and the following two expressions to calculate the number of open cases and the number of submitted cases:
* Count ({$<Open={'-1'}>} distinct [Incident Number])
* Count ({$<IsSubmissionMonth={'-1'}>} distinct [Incident Number])
However, my numbers are different from your graph, so you should check them...
HIC
- Mark as New
- Bookmark
- Subscribe
- Mute
- Subscribe to RSS Feed
- Permalink
- Report Inappropriate Content
Hi Henric,
Thanks for this amazing reply. It took me some time to understand the code. Everything is working good but in my raw data provided earlier, I had stripped some data to reduce the size, hence I did not supply the tail end of the data where "Last Resolved Date" is blank since it is unresolved and still open.
As a result the code is not capturing those tickets where "Last Resolved Date" is blank. This is because the iteration for While function is counting only till the <= MonthEnd([Last Resolved Date]) (?)
I did try using my logic for a workaround, but failed.
Could you please help me with this little niggle?
Waiting with anticipation.
Best Regards,
Tony
- Mark as New
- Bookmark
- Subscribe
- Mute
- Subscribe to RSS Feed
- Permalink
- Report Inappropriate Content
You need to replace a blank [Last Resolved Date] with Today() in some of the expressions. I would do the following (but I cannot test it since I don't have source data, so beware of bugs...) This way, also incidents that are still open will have an end date for the range: Today.
Leave the first table as it is. Change the second table to:
Months:
Load
MonthEnd(AddMonths(MonthStart([Submit Date]),IterNo()-1)) < RangeMin( Today() +1, [Last Resolved Date] ) as Open,
IterNo() = 1 as IsSubmissionMonth,
Date(AddMonths(MonthStart([Submit Date]),IterNo()-1),'YYYY MMM') as Month,
[Incident Number]
Resident Incidents
While MonthEnd(AddMonths(MonthStart([Submit Date]),IterNo()-1)) <= RangeMin( Today(), MonthEnd([Last Resolved Date]) ) ;
HIC
- Mark as New
- Bookmark
- Subscribe
- Mute
- Subscribe to RSS Feed
- Permalink
- Report Inappropriate Content
Hi Henric,
Smart and wonderful workaround. The logic is working just fine.
Thanks a ton,
Best Regards,
Tony
- Mark as New
- Bookmark
- Subscribe
- Mute
- Subscribe to RSS Feed
- Permalink
- Report Inappropriate Content
Hi Henric,
Continuing from here, I have doubts regarding how to show the chart as per certain condensations. Could you please have a look into Dynamic Chart with conditional showcase of months and come up with your expert advice?
As always awaiting with anticipation.
Best Regards,
Tony