Unlock a world of possibilities! Login now and discover the exclusive benefits awaiting you.
- Qlik Community
- :
- All Forums
- :
- QlikView App Dev
- :
- Edit show value in expression
- Subscribe to RSS Feed
- Mark Topic as New
- Mark Topic as Read
- Float this Topic for Current User
- Bookmark
- Subscribe
- Mute
- Printer Friendly Page
- Mark as New
- Bookmark
- Subscribe
- Mute
- Subscribe to RSS Feed
- Permalink
- Report Inappropriate Content
Edit show value in expression
Hi QVs,
I was trying to show only the values of a line chart which follow a condition, for example those that are in 2014. I edit the expression in show value with: =if(year(datefield)='2014', 1,0) but it doesn't work.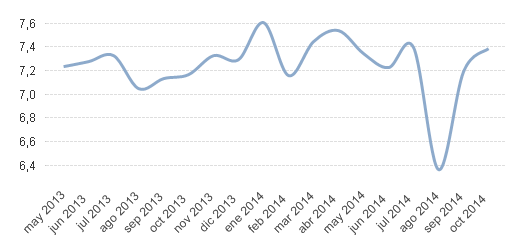
I found some discussions about it but i couldn't get a solution. Any idea?
Thanks for helping.
Marc.
- « Previous Replies
-
- 1
- 2
- Next Replies »
Accepted Solutions
- Mark as New
- Bookmark
- Subscribe
- Mute
- Subscribe to RSS Feed
- Permalink
- Report Inappropriate Content
- Mark as New
- Bookmark
- Subscribe
- Mute
- Subscribe to RSS Feed
- Permalink
- Report Inappropriate Content
Perhaps your date field is not properly formatted, use parsing fucntion date#() like:
=year(Date#(datefield, 'MMM YYYY'))=2014
- Mark as New
- Bookmark
- Subscribe
- Mute
- Subscribe to RSS Feed
- Permalink
- Report Inappropriate Content
use like
If(Year[Datefield] = '2014',Expression,0)
Expression is like - sum(Sales)
- Mark as New
- Bookmark
- Subscribe
- Mute
- Subscribe to RSS Feed
- Permalink
- Report Inappropriate Content
Field format is fine. Anyway i also tried with date# and date function, but no result.
- Mark as New
- Bookmark
- Subscribe
- Mute
- Subscribe to RSS Feed
- Permalink
- Report Inappropriate Content
Basically that's what I typed. Changing the 1 by another expression doesnt give any result neither.
- Mark as New
- Bookmark
- Subscribe
- Mute
- Subscribe to RSS Feed
- Permalink
- Report Inappropriate Content
Could you post a sample qvw?
- Mark as New
- Bookmark
- Subscribe
- Mute
- Subscribe to RSS Feed
- Permalink
- Report Inappropriate Content
PFA.
Marc.
- Mark as New
- Bookmark
- Subscribe
- Mute
- Subscribe to RSS Feed
- Permalink
- Report Inappropriate Content
The simple solution to your example file is:
=Count(IF(Year(FechaEncuesta)='2014',FechaEncuesta,NULL()))
I would recommend Set Analysis though.
Kind regards
Niklas
- Mark as New
- Bookmark
- Subscribe
- Mute
- Subscribe to RSS Feed
- Permalink
- Report Inappropriate Content
Niklas, the issue is not in the expression itself but in the 'show value' expression, explained in the initial post.
Thanks anyway.
- Mark as New
- Bookmark
- Subscribe
- Mute
- Subscribe to RSS Feed
- Permalink
- Report Inappropriate Content
Well, put my formula in the Show Value box.
See attached example.
Kind regards
Niklas
- « Previous Replies
-
- 1
- 2
- Next Replies »