Unlock a world of possibilities! Login now and discover the exclusive benefits awaiting you.
- Qlik Community
- :
- All Forums
- :
- QlikView App Dev
- :
- Evaluate Chart Expression at line level
- Subscribe to RSS Feed
- Mark Topic as New
- Mark Topic as Read
- Float this Topic for Current User
- Bookmark
- Subscribe
- Mute
- Printer Friendly Page
- Mark as New
- Bookmark
- Subscribe
- Mute
- Subscribe to RSS Feed
- Permalink
- Report Inappropriate Content
Evaluate Chart Expression at line level
Hello,
I’m trying to answer the following question using a Chart (Straight or Pivot Table) layout:
Considering that each product has one or more associated Markets , I want to know for each Product on the table, what is the total Sales Units on the product respective Markets but only on the Stores that have sold the product:
Something like this:
Product (dimension) | Sales Units (expression) |
Prod_A | Total Sales_Units of the Prod_A's Market, on the stores that sold Prod_A |
Prod_B | Total Sales_Units of the Prod_B's Market, on the stores that sold Prod_B |
Prod_C | … |
So far I can list all Market sales on each Product in the list, but I can’t make the filter for “only the stores that have sold the product” as I can´t manage to pass the Product Dimension through the aggr Total in expression.
I’m using the following expression so far:
=Sum(Aggr(SUM(TOTAL <Market> {<Market=P(Market)>} SalesUnits),Market,ProdName))
Please see attached a small example of the problem:
Thanks in advance for all your help
Pedro Freire
- « Previous Replies
-
- 1
- 2
- Next Replies »
- Mark as New
- Bookmark
- Subscribe
- Mute
- Subscribe to RSS Feed
- Permalink
- Report Inappropriate Content
Hello guys and thank you again for all your help!
As for the solution Sunny presented, it work perfectly until we had to move up one "notch".
On the January problem, we had one table with a one-to-one relationship between productcode and market.
Now we have grouped Products and for each ProductGroup it's possible to have more than one Product and More than one Market.
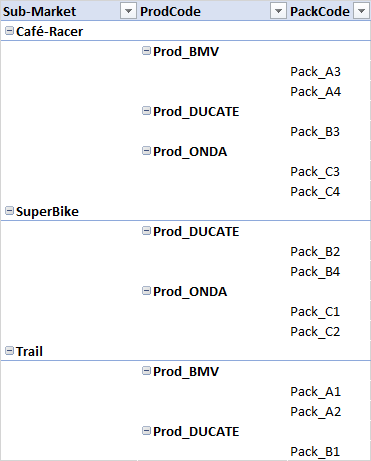
The expected result shoul be somthing like this:
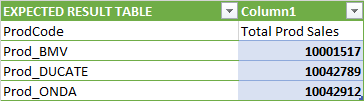
Like in January, the main objective is to to have a table where, for the stores that have soled each ProdCode we will have the Sum(SalesUnits) for the Sub-Markets (Categories) where this ProductCode belongs to.
Once again I thank you for your help!
- « Previous Replies
-
- 1
- 2
- Next Replies »