Unlock a world of possibilities! Login now and discover the exclusive benefits awaiting you.
- Qlik Community
- :
- All Forums
- :
- QlikView App Dev
- :
- Expression in straight chart
- Subscribe to RSS Feed
- Mark Topic as New
- Mark Topic as Read
- Float this Topic for Current User
- Bookmark
- Subscribe
- Mute
- Printer Friendly Page
- Mark as New
- Bookmark
- Subscribe
- Mute
- Subscribe to RSS Feed
- Permalink
- Report Inappropriate Content
Expression in straight chart
Hi!
I have created a straight chart using the following data:
| ProjectID | ProjectStatus | Date |
|---|---|---|
| 123456 | Started | 2014-01-01 |
| 123456 | Underway | 2014-02-01 |
| 123456 | Finished | 2014-03-01 |
| 234567 | Started | 2014-02-01 |
| 234567 | Underway | 2014-03-01 |
What I want to do is, I want this chart to show only ongoing Projects, in this case ProjectID 234567.
- Tags:
- new_to_qlikview
Accepted Solutions
- Mark as New
- Bookmark
- Subscribe
- Mute
- Subscribe to RSS Feed
- Permalink
- Report Inappropriate Content
Hi,
Try this way
Tab1:
LOAD
ProjectID,ProjectStatus,
Date#(Date,'YYYY-MM-DD') As Date;
Load *Inline
[
ProjectID,ProjectStatus,Date
123456,Started,2014-01-01
123456,Underway,2014-02-01
123456,Finished,2014-03-01
234567,Started,2014-02-01
234567,Underway,2014-03-01
];
Left Join
LOAD
ProjectID,
Concat(ProjectStatus,',') as Details
Resident Tab1 Group By ProjectID;
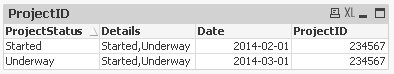
And on the front end
Dim1:- ProjectStatus
Dim2:- Date
Dim3:- Details
Expre:- =if(Details = 'Started,Underway', ProjectID)
Regards
Anand
- Mark as New
- Bookmark
- Subscribe
- Mute
- Subscribe to RSS Feed
- Permalink
- Report Inappropriate Content
Check this app
- Mark as New
- Bookmark
- Subscribe
- Mute
- Subscribe to RSS Feed
- Permalink
- Report Inappropriate Content
Hi,
Try this way
Tab1:
LOAD
ProjectID,ProjectStatus,
Date#(Date,'YYYY-MM-DD') As Date;
Load *Inline
[
ProjectID,ProjectStatus,Date
123456,Started,2014-01-01
123456,Underway,2014-02-01
123456,Finished,2014-03-01
234567,Started,2014-02-01
234567,Underway,2014-03-01
];
Left Join
LOAD
ProjectID,
Concat(ProjectStatus,',') as Details
Resident Tab1 Group By ProjectID;
And on the front end
Dim1:- ProjectStatus
Dim2:- Date
Dim3:- Details
Expre:- =if(Details = 'Started,Underway', ProjectID)
Regards
Anand
- Mark as New
- Bookmark
- Subscribe
- Mute
- Subscribe to RSS Feed
- Permalink
- Report Inappropriate Content
Create a Straight Table
Dimension
1)
Calculated Dimension
=Aggr(IF(SubStringCount(Concat(DISTINCT ProjectStatus,'|'),'Finished')=0,ProjectID),ProjectID)
2) ProjectStatus
3) Date
Expression
1
Go to Presentation Tab and Hide the Expression Column
- Mark as New
- Bookmark
- Subscribe
- Mute
- Subscribe to RSS Feed
- Permalink
- Report Inappropriate Content
Hi,
Or another without creating any field in the load script try this
On straight chart
Dim1:- =Aggr(if( Concat(ProjectStatus,',') = 'Started,Underway',ProjectID),ProjectID)
Note:- Suppress When Value is Null selected here
Dim2:- ProjectStatus
Expre:- Date
Regards,
Anand
- Mark as New
- Bookmark
- Subscribe
- Mute
- Subscribe to RSS Feed
- Permalink
- Report Inappropriate Content
Thank you!
This might work for my app,
Is there a way of making the ProjectID showing distinct?
- Mark as New
- Bookmark
- Subscribe
- Mute
- Subscribe to RSS Feed
- Permalink
- Report Inappropriate Content
Use DISTINCT key word otherwise i thing not required, if got the answer please close the thread with appropriate answer.
Regards,
Anand