Unlock a world of possibilities! Login now and discover the exclusive benefits awaiting you.
- Qlik Community
- :
- All Forums
- :
- QlikView App Dev
- :
- Re: Expression problem
- Subscribe to RSS Feed
- Mark Topic as New
- Mark Topic as Read
- Float this Topic for Current User
- Bookmark
- Subscribe
- Mute
- Printer Friendly Page
- Mark as New
- Bookmark
- Subscribe
- Mute
- Subscribe to RSS Feed
- Permalink
- Report Inappropriate Content
Expression problem
Hi all,
I have got an Excel Pivot table like the one below,
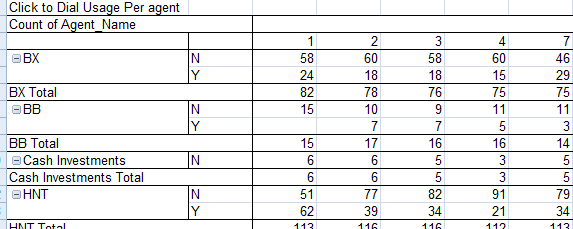 !
!
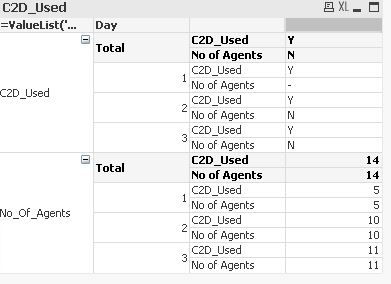
I have tried this in QV ,please the attached files
Dimension:=ValueList('C2D_Used','No_Of_Agents') and Day
Expresion:
=pick(Match(ValueList('C2D_Used','No_Of_Agents'),
'C2D_Used','No_Of_Agents'),
if(sum(if(CallTime > 0 , 1, 0)) > 0,'Y','N'),
Count(DISTINCT Consultant))
This does not give the needed result, it does not give me the 'N'. please assist.
PFA
- « Previous Replies
-
- 1
- 2
- Next Replies »
- Mark as New
- Bookmark
- Subscribe
- Mute
- Subscribe to RSS Feed
- Permalink
- Report Inappropriate Content
I didn't find Cash Investment at all on your Excel. Where do you pick that?
- Mark as New
- Bookmark
- Subscribe
- Mute
- Subscribe to RSS Feed
- Permalink
- Report Inappropriate Content
This does not give the needed result, it does not give me the 'N'.
What is the needed result? Can you share what you expect to see?
- Mark as New
- Bookmark
- Subscribe
- Mute
- Subscribe to RSS Feed
- Permalink
- Report Inappropriate Content
Hi Sunny T ,
I actually want to convert the two expressions into dimensions, just as they are shown in the pivot.
Regards
- Mark as New
- Bookmark
- Subscribe
- Mute
- Subscribe to RSS Feed
- Permalink
- Report Inappropriate Content
I actually want to convert the two expressions into dimensions, just as they are shown in the pivot.
- Mark as New
- Bookmark
- Subscribe
- Mute
- Subscribe to RSS Feed
- Permalink
- Report Inappropriate Content
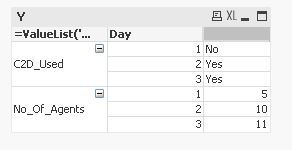
Hi,
You want like this.
- Mark as New
- Bookmark
- Subscribe
- Mute
- Subscribe to RSS Feed
- Permalink
- Report Inappropriate Content
This exactly what I am looking for and the date should be per day.
- Mark as New
- Bookmark
- Subscribe
- Mute
- Subscribe to RSS Feed
- Permalink
- Report Inappropriate Content
Hi,
you want like this,
- Mark as New
- Bookmark
- Subscribe
- Mute
- Subscribe to RSS Feed
- Permalink
- Report Inappropriate Content
Exactly that
- Mark as New
- Bookmark
- Subscribe
- Mute
- Subscribe to RSS Feed
- Permalink
- Report Inappropriate Content
Hi,
K. Script level write like this:-
Test:
LOAD CC,
Desk,
Consultant,
Team_Leader,
Year,
Month,
Day,
CallTime,
interval(CallTime,'ss') as CallTime1
FROM
C:\Users\arul.settu\Desktop\Test_data.xlsx
(ooxml, embedded labels, table is Sheet1);
And Chart level
Dim:-
1)=ValueList('C2D_Used','No_Of_Agents')
2)=ID
Exp:-
=if(ValueList('C2D_Used','No_Of_Agents')='C2D_Used',if(count({<CallTime1={'0','00'}>}CallTime1)> 0,'Yes','No'),
if(ValueList('C2D_Used','No_Of_Agents')='No_Of_Agents',Count(DISTINCT Consultant)))
- « Previous Replies
-
- 1
- 2
- Next Replies »