Unlock a world of possibilities! Login now and discover the exclusive benefits awaiting you.
- Qlik Community
- :
- All Forums
- :
- QlikView App Dev
- :
- Re: Extracting min and max value on Standard Devia...
- Subscribe to RSS Feed
- Mark Topic as New
- Mark Topic as Read
- Float this Topic for Current User
- Bookmark
- Subscribe
- Mute
- Printer Friendly Page
- Mark as New
- Bookmark
- Subscribe
- Mute
- Subscribe to RSS Feed
- Permalink
- Report Inappropriate Content
Extracting min and max value on Standard Deviation
Hi,
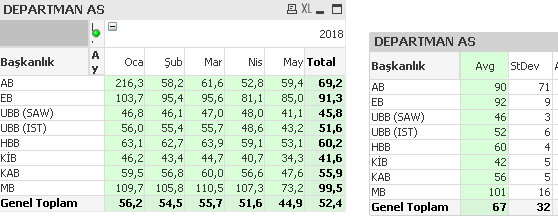
I have Avarage and St.Dev in this table. But I want to extract the min and max values when calculating Standard Deviation. Please help..??
I have added new straigt table and written this formula,
Avg: =avg(aggr((SUM([Fiili Maliyet Tutarı])/sum(([Fiili Miktar])*-1)),BASKANLIK,Kayıt_Donemi_Text))
StDev: =Stdev(aggr((SUM([Fiili Maliyet Tutarı])/sum(([Fiili Miktar])*-1)),BASKANLIK,Kayıt_Donemi_Text))
- Mark as New
- Bookmark
- Subscribe
- Mute
- Subscribe to RSS Feed
- Permalink
- Report Inappropriate Content
Hi,
I'm not sure to understand;
min and max with your formula don't work ?
regards
- Mark as New
- Bookmark
- Subscribe
- Mute
- Subscribe to RSS Feed
- Permalink
- Report Inappropriate Content
min and max values is calculating but I want to extract these when calculating the Standard Deviation.
- Mark as New
- Bookmark
- Subscribe
- Mute
- Subscribe to RSS Feed
- Permalink
- Report Inappropriate Content
Under the "expression"-tab of your chart, put "total mode" to "max of rows".
- Mark as New
- Bookmark
- Subscribe
- Mute
- Subscribe to RSS Feed
- Permalink
- Report Inappropriate Content
Thank you Mr Simen but I couldn't try this,because it is deactive.
- Mark as New
- Bookmark
- Subscribe
- Mute
- Subscribe to RSS Feed
- Permalink
- Report Inappropriate Content
It is only possible in a Straight Table.
I think if you want it in your pivot table you need to do a nested Aggr.
so max(aggr(stdev(aggr(....,)),))
- Mark as New
- Bookmark
- Subscribe
- Mute
- Subscribe to RSS Feed
- Permalink
- Report Inappropriate Content
Can you attach the sample data and expected result?
- Mark as New
- Bookmark
- Subscribe
- Mute
- Subscribe to RSS Feed
- Permalink
- Report Inappropriate Content
Example is attached.