Unlock a world of possibilities! Login now and discover the exclusive benefits awaiting you.
- Qlik Community
- :
- All Forums
- :
- QlikView App Dev
- :
- Filled line chart - issues when having negative va...
- Subscribe to RSS Feed
- Mark Topic as New
- Mark Topic as Read
- Float this Topic for Current User
- Bookmark
- Subscribe
- Mute
- Printer Friendly Page
- Mark as New
- Bookmark
- Subscribe
- Mute
- Subscribe to RSS Feed
- Permalink
- Report Inappropriate Content
Filled line chart - issues when having negative values (Qlikview)
Dear all,
I working with a line chart with positive and negative values. I was able to do it QlikSense but am having problems when doing it in QlikView (both images, QV and QS, are attached below).
As you may see, in QlikView file, line is filled from the actual value to the bottom of the graph. That's wrong!! It should be filled only from zero to the actual value.
Just a note: numeric values may change from one picture to the other one. That's not the issue!
I would really appreciate if anyone could help solve this issue. Thank you very much in advance.
Best regards,
Gonzalo
- Mark as New
- Bookmark
- Subscribe
- Mute
- Subscribe to RSS Feed
- Permalink
- Report Inappropriate Content
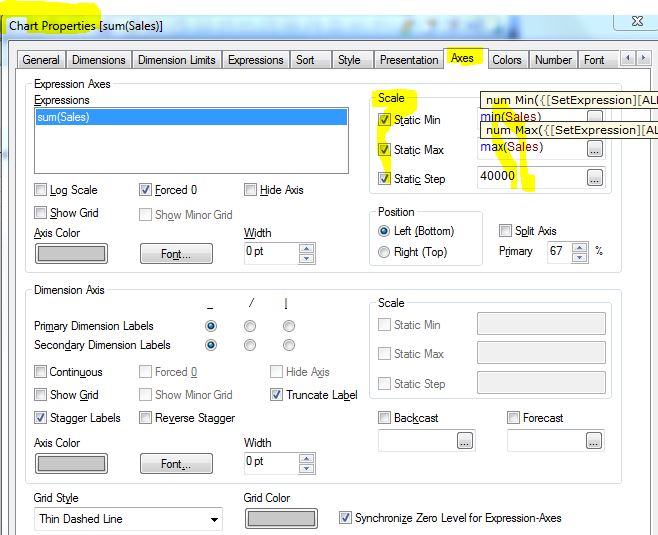
hi,
Try to set scale range line by min, max expression like below screen shot
- Mark as New
- Bookmark
- Subscribe
- Mute
- Subscribe to RSS Feed
- Permalink
- Report Inappropriate Content
Hi Gonzalo,
Is that what you want?
.PNG)
Please check the attachment.
Thanks.
Aiolos
- Mark as New
- Bookmark
- Subscribe
- Mute
- Subscribe to RSS Feed
- Permalink
- Report Inappropriate Content
Hi Aiolos,
Yes, that's what I'm trying to achieve. Unfortunately, I am working with Personal Edition Qlikview and can't open the attached file. Please could you make a brief summary of the followed steps? It would be highly appreciated.
Thank you very much in advance.
Best regards,
Gonzalo
- Mark as New
- Bookmark
- Subscribe
- Mute
- Subscribe to RSS Feed
- Permalink
- Report Inappropriate Content
Hi Gonzalo,
Sorry to reply late.
I just created a line chart, and in Properties, in Style tab, in Look part choose fourth one.
Please have a try.
And questions please tell me.
Thanks
Aiolos