Unlock a world of possibilities! Login now and discover the exclusive benefits awaiting you.
- Qlik Community
- :
- All Forums
- :
- QlikView App Dev
- :
- Find the Date for the MAX or MIN Value
- Subscribe to RSS Feed
- Mark Topic as New
- Mark Topic as Read
- Float this Topic for Current User
- Bookmark
- Subscribe
- Mute
- Printer Friendly Page
- Mark as New
- Bookmark
- Subscribe
- Mute
- Subscribe to RSS Feed
- Permalink
- Report Inappropriate Content
Find the Date for the MAX or MIN Value
Hello,
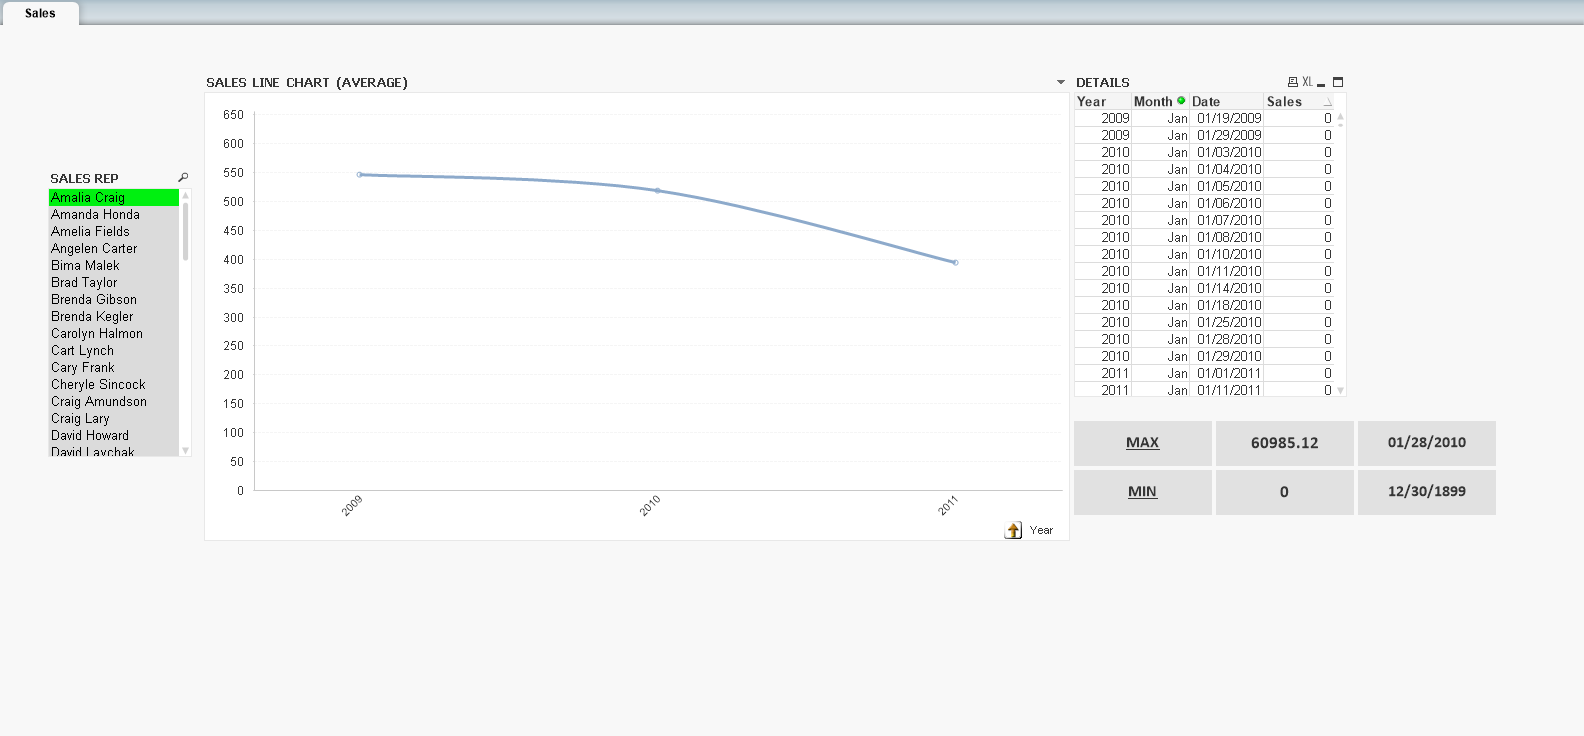
I have a line chart for sales and a table where you can see the detail for every sale from a particular sales rep.
What I need is to get the max and min values (sales) for a specific sales rep with the corresponding date...
I've tried it using the following expressions in a text box:
MAX: =MAX(Sales)
DATE (From MAX): =DATE(SUM(AGGR(FIRSTSORTEDVALUE(Date,-Sales),[Sales Rep])),'MM/DD/YYYY')
MIN: =MIN(Sales)
DATE (From MIN): =DATE(SUM(AGGR(FIRSTSORTEDVALUE(Date,Sales),[Sales Rep])),'MM/DD/YYYY')
The expression for DATE works well when I have one single value for the MAX/MIN.
In the case of MAX, the corresponding date for 60985.12 is 01/28/2010.
But, in the case of MIN, which is 0 for sales rep Amalia Craig, there are multiple dates, and the output shows 12/30/1899.
Do you know if there's any way to show:
- For the MAX value, show the MAX date, corresponding to that MAX value?
- For the MIN value, show the MIN date, corresponding to that MIN value?
Please, find QVW attached.
Thank you!
- Tags:
- new_to_qlikview
- Mark as New
- Bookmark
- Subscribe
- Mute
- Subscribe to RSS Feed
- Permalink
- Report Inappropriate Content
Hi,
PFA .i hope it help to u
- Mark as New
- Bookmark
- Subscribe
- Mute
- Subscribe to RSS Feed
- Permalink
- Report Inappropriate Content
Thanks Perumal, I'll check it out and see how it works!