Unlock a world of possibilities! Login now and discover the exclusive benefits awaiting you.
- Qlik Community
- :
- All Forums
- :
- QlikView App Dev
- :
- Finding Max, Min and Average Value in a Quarter
- Subscribe to RSS Feed
- Mark Topic as New
- Mark Topic as Read
- Float this Topic for Current User
- Bookmark
- Subscribe
- Mute
- Printer Friendly Page
- Mark as New
- Bookmark
- Subscribe
- Mute
- Subscribe to RSS Feed
- Permalink
- Report Inappropriate Content
Finding Max, Min and Average Value in a Quarter
Hello Community,
Found a similar thread on the community and applied the solution available on the community. but my requirement is bit different and not able to apply this logic to solve my issue and need assistance. Please help
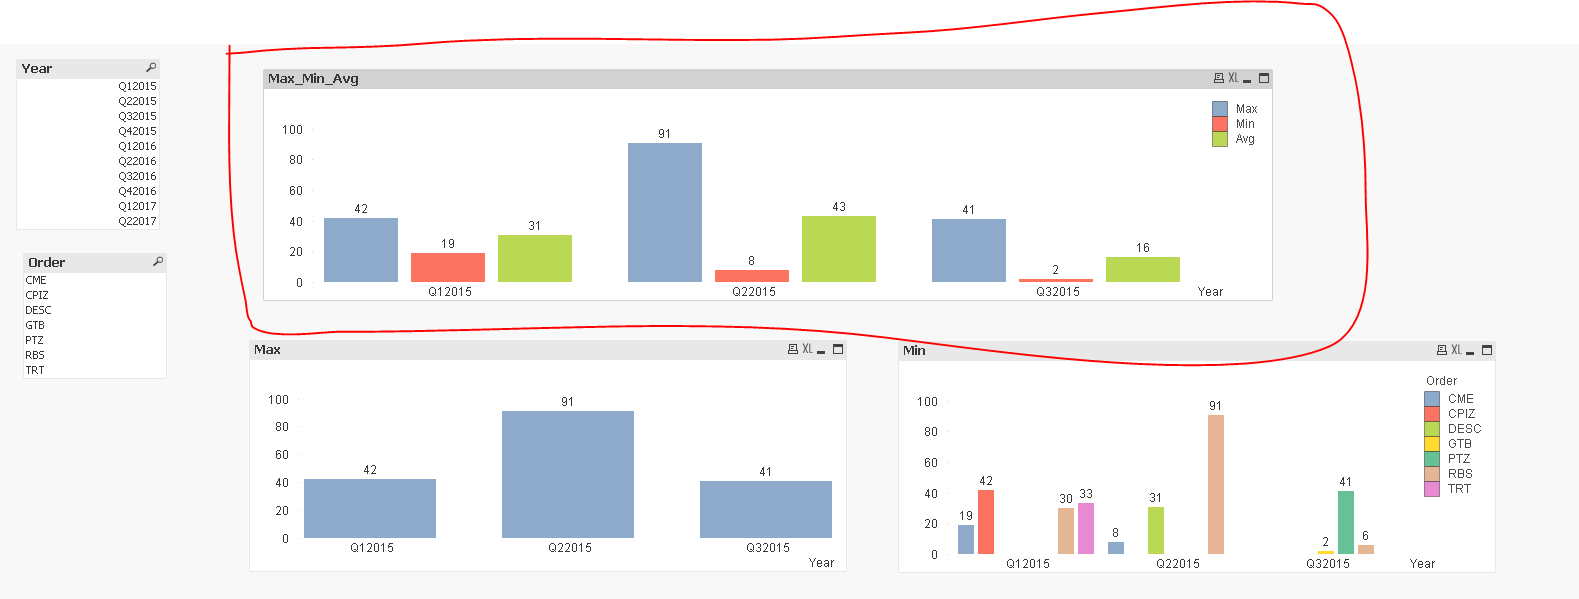
In the attached qvw I’m trying to display the max, min and average value in a quarter not sure how to achieve that. Please help
For example: In Q12015- The chart should display: Max value-42(CPIZ)
Min Value- 19(CME)
Average- (42+19+30+33)/4= 31
Thank you,
Ramya
- « Previous Replies
-
- 1
- 2
- Next Replies »
Accepted Solutions
- Mark as New
- Bookmark
- Subscribe
- Mute
- Subscribe to RSS Feed
- Permalink
- Report Inappropriate Content
- Mark as New
- Bookmark
- Subscribe
- Mute
- Subscribe to RSS Feed
- Permalink
- Report Inappropriate Content
Any suggestions or help please?
- Mark as New
- Bookmark
- Subscribe
- Mute
- Subscribe to RSS Feed
- Permalink
- Report Inappropriate Content
I am not able to open the app. Can you please explain the scenario with sample data .
- Mark as New
- Bookmark
- Subscribe
- Mute
- Subscribe to RSS Feed
- Permalink
- Report Inappropriate Content
Hi Sujeet,
Thank you so much for the response.
My data model is very simple, loaded data from single source table then 1st trying to calculate the number of days between the two dates in the script based on the “date accepted” and “type”.
Description:
Each order (Order) will have a BCT, ECT and ADP (Type) line. I’m trying to calculate the number of days it takes to each order to get from BCT to ECT based on the “Date Accepted” column. If “Date Accepted” is blank just need to ignore that order.
When I tried, subtracting the two dates it’s not dividing the days correctly between quarters. I found solution for this on the qlik community where they used InQuarter function, that calculates the days correctly between quarters. But my requirement is I need to display only the Oder’s that took 1. maximum number of days,
2. minimum number of days
3. What’s the Average numbers of days in each quarter
I’m attaching a .qvf file please look into it. I tried multiple methods but I’m still novice in qlik . So please help me. If still not clear please let me know. Thank you,
Expected output:
For example: In Q12015- The chart should display: Max value-42(CPIZ)
Min Value- 19(CME)
Average- (42+19+30+33)/4= 31
Currently I’m using a bar chart but it’s ok to have 3 expressions showing 3 lines ( max, min and avg) in a line chart.
- Mark as New
- Bookmark
- Subscribe
- Mute
- Subscribe to RSS Feed
- Permalink
- Report Inappropriate Content
its.anandrjsstalwar1@ Hi, Sunny and Anand if you get a chance please help me with this. Thank you,
Ramya
- Mark as New
- Bookmark
- Subscribe
- Mute
- Subscribe to RSS Feed
- Permalink
- Report Inappropriate Content
any help please?
- Mark as New
- Bookmark
- Subscribe
- Mute
- Subscribe to RSS Feed
- Permalink
- Report Inappropriate Content
May be attached?
=Sum(Aggr(IF(InQuarter(min(CDate), Quarter_Start, 0) AND InQuarter(min([BDate]), Quarter_Start, 0), min(CDate) - min([BDate]), IF (InQuarter(min(CDate), Quarter_Start, 0), min(CDate) - Quarter_Start,
IF (InQuarter(min([BDate]), Quarter_Start, 0), DayStart(Quarter_End) - min([BDate]),
IF (not(InQuarter(min(CDate), Quarter_Start, 0)) and not(InQuarter(min([BDate]), Quarter_Start, 0)) and min(CDate) > Quarter_Start and min([BDate]) < Quarter_End, Quarter_End - Quarter_Start)))), Year, Order))/4
For Quarter 1 and Left all this..
- Mark as New
- Bookmark
- Subscribe
- Mute
- Subscribe to RSS Feed
- Permalink
- Report Inappropriate Content
Sorry forgot to attach the qvf, please help me if you get a chance.
- Mark as New
- Bookmark
- Subscribe
- Mute
- Subscribe to RSS Feed
- Permalink
- Report Inappropriate Content
Hi Anil,
Thank you so much for the response but unfortunately that doesn't work. The requirement is to display the order that took maximum number days in a quarter, minimum number of days in a quarter and average number of days of all the orders in a quarter.
For example Expected result for Q12015-
The chart should display: Max value-42(CPIZ)
Min Value- 19(CME)
Average- (42+19+30+33)/4= 31
For Q22015:
Max value-91(RBS)
Min Value- 8(CME)
Average- (8+31+91)/3= 43.33
I'm not sure my requirement is not clear or it's too complex, please let me know if still the requirement is not clear. It's ok to use 3 different expressions one for max, one for min and one for avg. Please look into the attached qvw. Thank you,
Ramya
- Mark as New
- Bookmark
- Subscribe
- Mute
- Subscribe to RSS Feed
- Permalink
- Report Inappropriate Content
Can you make output in straight table / graph in excel. Because, Don't think so this is that much complex. We can beat even if it is complex. But, Expected result and layout may useful to check
- « Previous Replies
-
- 1
- 2
- Next Replies »