Unlock a world of possibilities! Login now and discover the exclusive benefits awaiting you.
- Qlik Community
- :
- All Forums
- :
- QlikView App Dev
- :
- Forced Selection in Pivot Table
- Subscribe to RSS Feed
- Mark Topic as New
- Mark Topic as Read
- Float this Topic for Current User
- Bookmark
- Subscribe
- Mute
- Printer Friendly Page
- Mark as New
- Bookmark
- Subscribe
- Mute
- Subscribe to RSS Feed
- Permalink
- Report Inappropriate Content
Forced Selection in Pivot Table
Hi all!
Here I am again with another tricky question. 
I would like to know if is possible in a list box, to have a column which is not considering Dimension limit or that I can force to make a total sum of some specific fields;
As is not easy to say in words, herewith you can find a sample which will be more clear to understand.
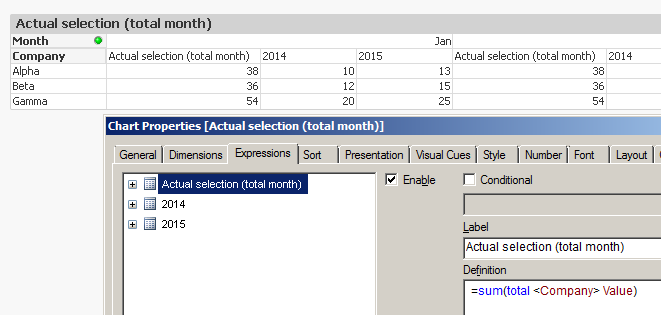
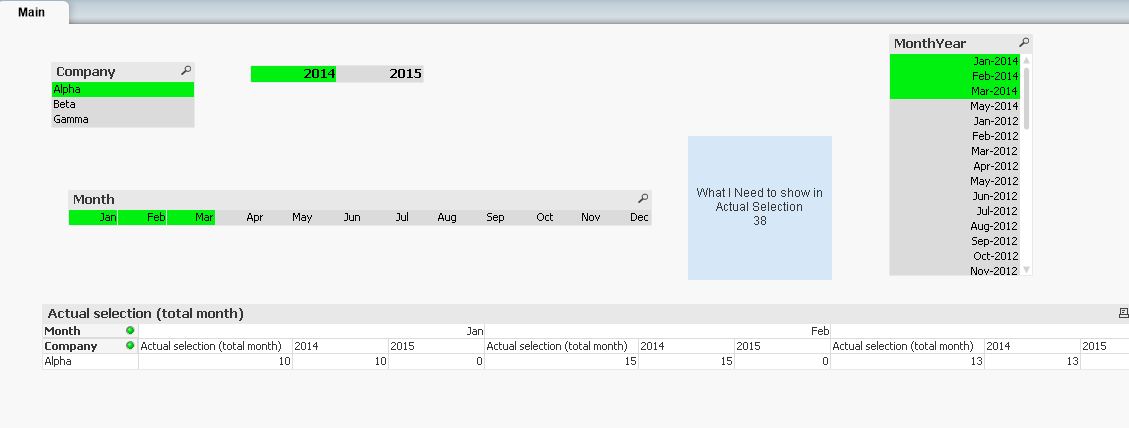
Inside you'll find a Pivot Table where my Dimensions are 'Company' and 'Month';
My Request is: to have total (by Month) for prev Year and Curr Year, plus, a colum where I can see total amount in case user select more then 1 month.
For instance: if I select
Jan + Feb + Mar
- 2014
- Alpha
I would like to see 38 (Jan 10 + Feb 15 + Mar 13)
Is there a possibility to do that in the same List box?
Thank you for your help or any suggestions!
Alex
- « Previous Replies
-
- 1
- 2
- Next Replies »
Accepted Solutions
- Mark as New
- Bookmark
- Subscribe
- Mute
- Subscribe to RSS Feed
- Permalink
- Report Inappropriate Content
- Mark as New
- Bookmark
- Subscribe
- Mute
- Subscribe to RSS Feed
- Permalink
- Report Inappropriate Content
See attached qvw. Is that what you want?
talk is cheap, supply exceeds demand
- Mark as New
- Bookmark
- Subscribe
- Mute
- Subscribe to RSS Feed
- Permalink
- Report Inappropriate Content
Just add Month-Year as a list box. Then click Alpha, then Jan-2014 to Mar-2014?
You can use CTRL to select more than one option in a list box, ie Hold Down CTRL and then click the filters you want.
- Mark as New
- Bookmark
- Subscribe
- Mute
- Subscribe to RSS Feed
- Permalink
- Report Inappropriate Content
Thank you gwassenaar and dmac1971!
First Solution its amazing and I will keep in mind (or eventually I'll set up something if there is no way to do it in the same chart)
[I just realize that I wrote "Is there a possibility to do that in the same List box?" and it was my mistake cause I mean Is there a possibility to do that in the same Pivot Table?" - Sorry  ]
]
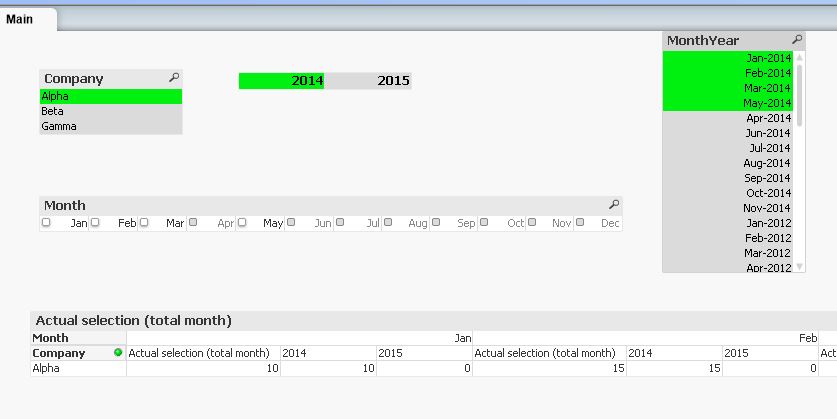
So, solution is ok but what I need is to have exactly your solution but here:
I've tryed out your idea, but is not working properly:
Thank you anyway!
Alex
- Mark as New
- Bookmark
- Subscribe
- Mute
- Subscribe to RSS Feed
- Permalink
- Report Inappropriate Content
It wont work as is because you have chosen LED format for the month list box. Change it back to default and it works perfectly.
- Mark as New
- Bookmark
- Subscribe
- Mute
- Subscribe to RSS Feed
- Permalink
- Report Inappropriate Content
dmac1971 probably I am doing something wrong...
....but what? 
Changed to default, bus still having same result; did you changed something in the expression?
- Mark as New
- Bookmark
- Subscribe
- Mute
- Subscribe to RSS Feed
- Permalink
- Report Inappropriate Content
Hi Alex,
Remove the Month-Year ListBox, as you no longer have the LED type on the Month List box you wont need them.
Then clicking on Alpha, 2014 and then Click on JAN, keep mouse button down and also select Feb and March should give you what you need.
Dermot.
- Mark as New
- Bookmark
- Subscribe
- Mute
- Subscribe to RSS Feed
- Permalink
- Report Inappropriate Content
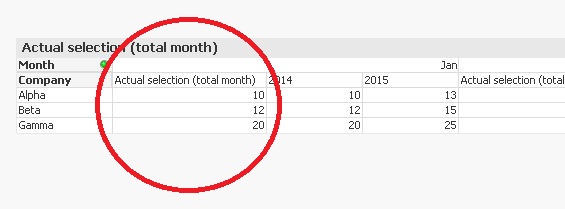
dmac1971, I think we are talking about different thing;
with a second better look on the image you've posted, (I didn't enlarge before), I realize that even in your way, the "Actual selection (total Month), is not working properly; it's still showing "10" as Total of 3 Months selected, but is not correct.
Right one is what I've already shown in the text box (38).
At this point probably I think I have to change completely the meaning of Pivot Table, maybe with a separate ListBox showing Grand Total of Selection.
If there are any other suggestion, they're welcome...otherwise, thank you for your patience and collaboration!
Alex
- Mark as New
- Bookmark
- Subscribe
- Mute
- Subscribe to RSS Feed
- Permalink
- Report Inappropriate Content
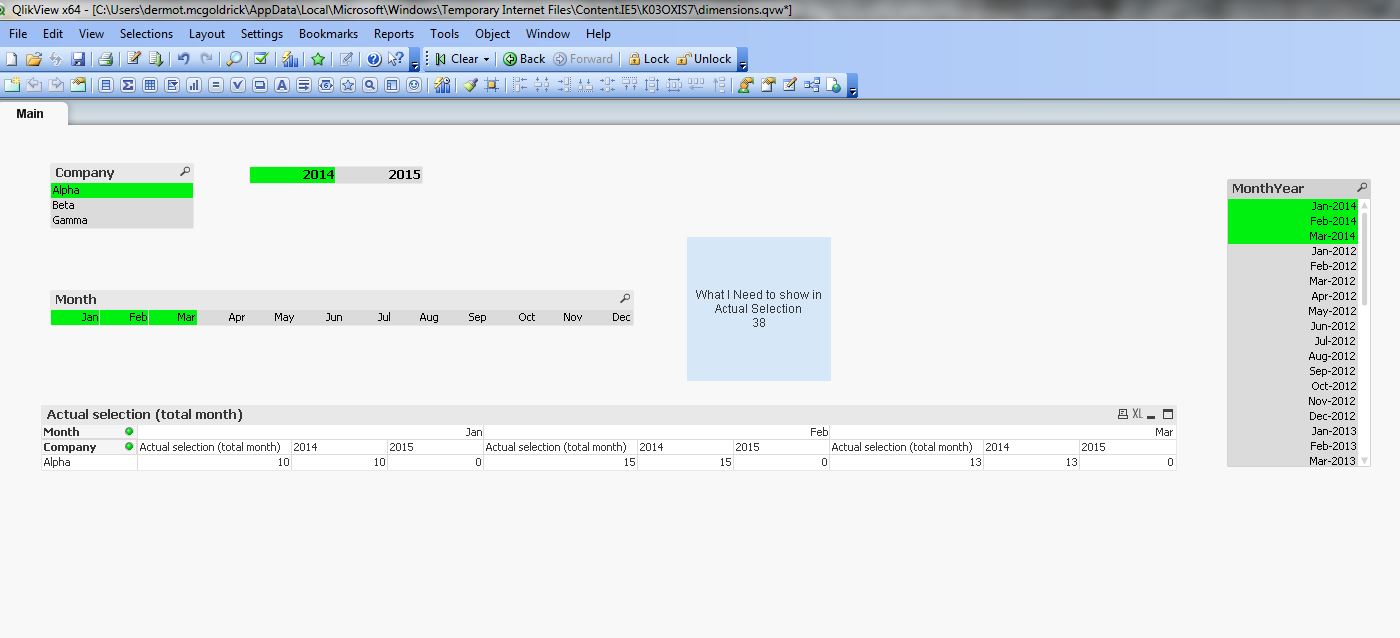
Alex here's your original file with the month list box changed to a normal format and the three months selected. The result is 38 and your text box appears, isn't this what you wanted to achieve? Apologies if I've picked it up wrong!
Have added straight table to show results, and a dynamic heading showing the current year selected.

- Mark as New
- Bookmark
- Subscribe
- Mute
- Subscribe to RSS Feed
- Permalink
- Report Inappropriate Content
Thank dmac1971!
I see that with the Straight Table is almost working but, still have some problem.
Let me show you something:
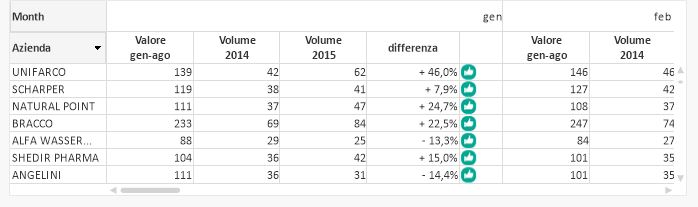
This is the situation for what I am asking solution.
I can't move "Month" dimension on left side, cause I have multiple data focuses;
This is the best visualization I can use in this moment due to spaces in the sheet (all spaces already filled up).
Switching on left "Month" means having a never ending scroll down, cause for any Company/Products/etc I have a division of month, value 2014, value 2015 toooooooo much long and not easy to use as rapid sight for main important data.
So, that's why I've requested if possible to have the first column with a kind of forced expression who doesn't take care of Month Dimension, but consider my actual selection.
I think there's no solution on this way.
Probably I must change completely the format/type of chart...even changin in ListBox maybe.
I tryout some combination now, with your suggestions and the first Idea of gwassenaar..maybe I can put a Listbox overlaying a part of Pivot Table...or something like that.
However, thank you very much for your help!
Alex
- « Previous Replies
-
- 1
- 2
- Next Replies »