Unlock a world of possibilities! Login now and discover the exclusive benefits awaiting you.
- Qlik Community
- :
- All Forums
- :
- QlikView App Dev
- :
- Re: Forcing all labels to be visable after selecti...
- Subscribe to RSS Feed
- Mark Topic as New
- Mark Topic as Read
- Float this Topic for Current User
- Bookmark
- Subscribe
- Mute
- Printer Friendly Page
- Mark as New
- Bookmark
- Subscribe
- Mute
- Subscribe to RSS Feed
- Permalink
- Report Inappropriate Content
Forcing all labels to be visable after selection
Another challenge for you all!
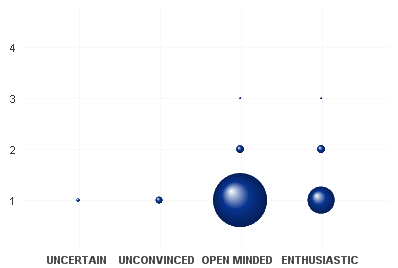
I am using a bubble chart to show results of mobility and change levels.
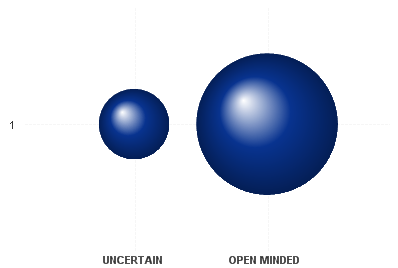
When I have all data selected all of the labels are there, however when I filter to a lower level labels are lost.
How can I force the label to always stay?
Not filtered
Filtered
Thanks
Rob
- « Previous Replies
-
- 1
- 2
- Next Replies »
- Mark as New
- Bookmark
- Subscribe
- Mute
- Subscribe to RSS Feed
- Permalink
- Report Inappropriate Content
Maybe I misunderstood your requirement, but what's wrong with the solution Henric suggested?
How do you want the chart to react on user selections?
- Mark as New
- Bookmark
- Subscribe
- Mute
- Subscribe to RSS Feed
- Permalink
- Report Inappropriate Content
Hi, what I'm after is the chart to look like the first chart in this string of dialogue.
It has the 4 labels along the bottom and the four on the left of the chart. When I filter the chart (see the next chart) I would like all the labels to stay visible.
I can achieve this by un-checking "Suppress Zero-Values" However this presents additional Null values in the chart. (see the third chart). If I then "Suppress when value is Null" it reverts to the second chart
Not sure that clarifies things.
Thanks
Rob
- Mark as New
- Bookmark
- Subscribe
- Mute
- Subscribe to RSS Feed
- Permalink
- Report Inappropriate Content
Hi Rob,
when I compare your requirement to my Profile_2.qvw attached above, I see exactely this: Four labels to the bottom and four labels to the left even after making selections.
(and it's probably just a matter of taste if you want to hide the excluded values completely or keep them in with a greyish color like Henric did)
So I must miss something else you are after.
Regards,
Stefan
- Mark as New
- Bookmark
- Subscribe
- Mute
- Subscribe to RSS Feed
- Permalink
- Report Inappropriate Content
Hi Stefan, apologies - you are right.
It was more a matter of trying to make it work how it should through the calculations!
If I could ask for one more bit of help - I was wanting the bubble colours to always have the colour 7 from the palette.
Thanks Rob
Henric, your help also appreciated.
- Mark as New
- Bookmark
- Subscribe
- Mute
- Subscribe to RSS Feed
- Permalink
- Report Inappropriate Content
You really want the colour 7 from the palette used in my sample  ?
?
No, just kidding, you just need to specifiy the color in the background color attribute expression:
=if(Count(Profile)=0,argb(0,255,255,255),color(7))
or specify the color using rgb values:
=if(Count(Profile)=0,argb(0,255,255,255),rgb(231,138,210))
- Mark as New
- Bookmark
- Subscribe
- Mute
- Subscribe to RSS Feed
- Permalink
- Report Inappropriate Content
 no not from your sample but the colour 7 in my qvw
That has sorted it though.
By the looks of it I still need to get the database person to sort the relationships for the data to the filters I'm using but the way it works now is what I need.
Thanks
Rob
- « Previous Replies
-
- 1
- 2
- Next Replies »