Unlock a world of possibilities! Login now and discover the exclusive benefits awaiting you.
- Qlik Community
- :
- All Forums
- :
- QlikView App Dev
- :
- Formatting Y Axis & scale of graph
- Subscribe to RSS Feed
- Mark Topic as New
- Mark Topic as Read
- Float this Topic for Current User
- Bookmark
- Subscribe
- Mute
- Printer Friendly Page
- Mark as New
- Bookmark
- Subscribe
- Mute
- Subscribe to RSS Feed
- Permalink
- Report Inappropriate Content
Formatting Y Axis & scale of graph
HI
i have created a horizontal block graph but the problem i have got is that the captions on the y axis are too long to fit into the available space so often you see half a word with lots of dots after.
What i would like to do is to keep the graph the same size but change the layout so there is more room for the y axis and to make the graph smaller, only problem is i can't work out how to do it. The other thought i had was to change the size of the font on the Y axis but again i can't see how to do this
Is anyone able to help me
Thanks
- Tags:
- new_to_qlikview
- Mark as New
- Bookmark
- Subscribe
- Mute
- Subscribe to RSS Feed
- Permalink
- Report Inappropriate Content
Axis size should be automatically sized after the longest texts, however there is a limit to how much of the total chart width that will be used for axis (1/3rd i belive). You can resize the axis manually by pressing Shift+Alt and Dragging the appropriate side of your chart.
- Mark as New
- Bookmark
- Subscribe
- Mute
- Subscribe to RSS Feed
- Permalink
- Report Inappropriate Content
Meant to write Shift+Ctrl, not Shift+Alt.
- Mark as New
- Bookmark
- Subscribe
- Mute
- Subscribe to RSS Feed
- Permalink
- Report Inappropriate Content
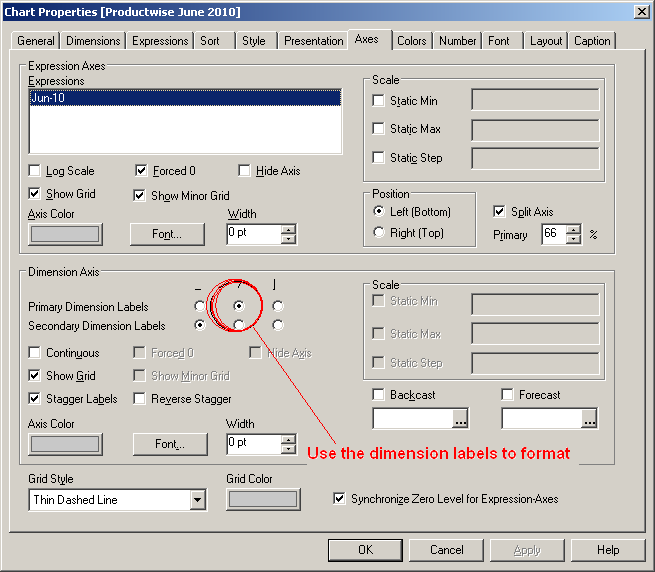
Right click on Graph -----> Goto properties ---> Goto Axis tab ---> Now we have two frames here
1. Expression axis i.e. Y Axis and
2. Dimension Axis i.e. X Axis.
You can change font for both the axis seperately from this tab. Also you can redefine the dimension of the labels for X axis.
Also, you can relocate the position of the sub objects by using "Shift + Ctrl" Key while selecting Graph. See the image attached.
Regards,
Shumail
- Mark as New
- Bookmark
- Subscribe
- Mute
- Subscribe to RSS Feed
- Permalink
- Report Inappropriate Content
Also see the below image as well
- Mark as New
- Bookmark
- Subscribe
- Mute
- Subscribe to RSS Feed
- Permalink
- Report Inappropriate Content
thanks very much - this is very helpful
- Mark as New
- Bookmark
- Subscribe
- Mute
- Subscribe to RSS Feed
- Permalink
- Report Inappropriate Content
I changed the font size of my Y axis for my horizontal bar chart by going to: Presentation tab > Settings button > Font button. Every other font button did not work for me