Unlock a world of possibilities! Login now and discover the exclusive benefits awaiting you.
- Qlik Community
- :
- All Forums
- :
- QlikView App Dev
- :
- Gantt Chart
- Subscribe to RSS Feed
- Mark Topic as New
- Mark Topic as Read
- Float this Topic for Current User
- Bookmark
- Subscribe
- Mute
- Printer Friendly Page
- Mark as New
- Bookmark
- Subscribe
- Mute
- Subscribe to RSS Feed
- Permalink
- Report Inappropriate Content
Gantt Chart
Hi there,
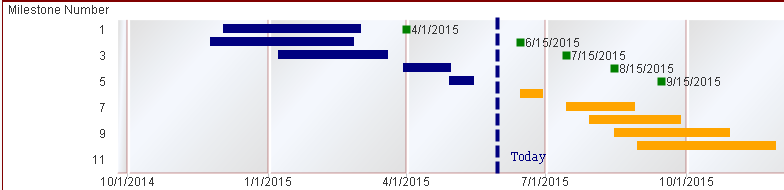
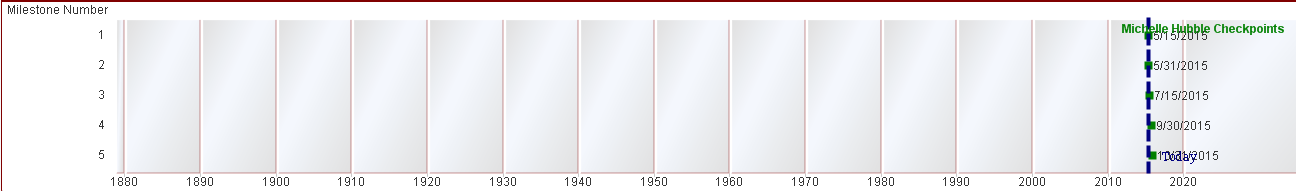
I have been asked to update the Gantt chart (I never worked with Gantt chart before) with new spreadsheet. There were some changes to the titles and an extra column. However, when I reloaded chart does not look the same. Instead of timeline showing each month(before pic), it shows each 10 years (after pic). I did not change properties, except for replacing appropriate titles. Could anyone tell me please how to reset to show each month again?
Thank you!
Before
After
- Mark as New
- Bookmark
- Subscribe
- Mute
- Subscribe to RSS Feed
- Permalink
- Report Inappropriate Content
Hi Nina,
I haven't work on Gantt charts earlier. I found an article about Gantt Charts. Hope it will helpful to make changes for your requirement. Please look at the below link:
- Mark as New
- Bookmark
- Subscribe
- Mute
- Subscribe to RSS Feed
- Permalink
- Report Inappropriate Content
Hi Nina,
What changes exactly you have made?
Is that possible to provide sample app before change and after change for easy debugging?
- Mark as New
- Bookmark
- Subscribe
- Mute
- Subscribe to RSS Feed
- Permalink
- Report Inappropriate Content
It seems that your dates gets messed up so end up with not with a single year but more than a century. So I would look at how the days are interpreted in the load script. Maybe an Excel date is formatted wrongly so it is reset to the first date that Excel can recognize which is I think back in that last day of the 19th century
- Mark as New
- Bookmark
- Subscribe
- Mute
- Subscribe to RSS Feed
- Permalink
- Report Inappropriate Content
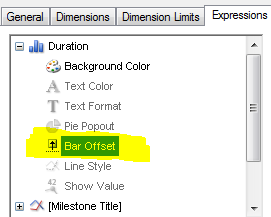
I was able to fix the issue. As I mentioned before some field name changed and I updated everywhere except here. Once I did that, the chart is working properly. 
Thank you everyone!