Unlock a world of possibilities! Login now and discover the exclusive benefits awaiting you.
- Qlik Community
- :
- All Forums
- :
- QlikView App Dev
- :
- Get the Value which is difference of current and p...
- Subscribe to RSS Feed
- Mark Topic as New
- Mark Topic as Read
- Float this Topic for Current User
- Bookmark
- Subscribe
- Mute
- Printer Friendly Page
- Mark as New
- Bookmark
- Subscribe
- Mute
- Subscribe to RSS Feed
- Permalink
- Report Inappropriate Content
Get the Value which is difference of current and previous value of the same field
Hi all,
I am facing an issue wherein I want to display the Metric in the pivot chart. The value is difference of current value and previous value of the same field
| Country | Sector | Region | Volume | Period |
| India | Automobile | South | 130 | 0 |
| US | HealthCare | South | 140 | 0 |
| UK | Tourism | West | 150 | 0 |
| JPN | Tech | North | 100 | 0 |
| India | Automobile | South | 180 | 3 |
| US | HealthCare | South | 200 | 3 |
| UK | Tourism | West | 300 | 3 |
| JPN | Tech | North | 50 | 3 |
| India | Automobile | South | 230 | 6 |
| US | HealthCare | South | 300 | 6 |
| UK | Tourism | West | 400 | 6 |
| JPN | Tech | North | 100 | 6 |
What I desire is:
| Country | Sector | Q0 | Q1 (Q1-Q0) | Q2 (Q2-Q1 |
| India | Automobile | 0 | 180-130 | 230-180 |
| US | HealthCare | 0 | 200-140 | 300-200 |
| UK | Tourism | 0 | 300-150 | 400-300 |
| JPN | TECH | 0 | 50-100 | 100-50 |
Tried using the below expression:
(Sum(Volume)-Before(Sum(Voilume),1))
The issue with this expression is that when I select any quarter, it does not work. If I don't select any quarter it works fine.
I tried to generate this field in my load script, but the numbers are not adding up.
- « Previous Replies
-
- 1
- 2
- Next Replies »
Accepted Solutions
- Mark as New
- Bookmark
- Subscribe
- Mute
- Subscribe to RSS Feed
- Permalink
- Report Inappropriate Content
You point out an issue very similar to what I'd said.
"...user confusion about what is being selected when there are two different Period fields..."
I would probably hide the original Period field, and only let the users select the As Of Period field. And then to try to help avoid user confusion, I might change the name of Period to Real Period, and As Of Period to Period. So from the user's perspective, they're selecting the Period like normal. The problem then is that without further effort, every expression in the whole application has to take into account the fact that when they select a Period, you actually end up with two Real Periods being selected, and you have to exclude the one you don't want. I rarely use As Of tables, partly for this reason. When I have, I believe what I did was something more like this:
Period, Type, Real Period
0,Current,0
3,Current,3
6,Current,6
3,Previous,0
6,Previous,3
And then on open of the document, triggered selecting and locking Type = 'Current'. At that point, expressions will behave as you would expect them to when selecting the Period. The only time you need to worry about it is when you want something other than the current period. So then your chart would be like this:
Dimensions = Country, Sector, Period
Current Quarter = sum(Volume)
Difference Based on Quarters = [Current Quarter] - sum({<Type={'Previous'}>} Volume)
Our data model is no longer handling everything for us, and we're using set analysis to get the previous period. And that's fine, just not as clean a solution as I'd hope for.
- Mark as New
- Bookmark
- Subscribe
- Mute
- Subscribe to RSS Feed
- Permalink
- Report Inappropriate Content
Please try Above() and Before() functions
- Mark as New
- Bookmark
- Subscribe
- Mute
- Subscribe to RSS Feed
- Permalink
- Report Inappropriate Content
Documentation and examples Examples of Chart Inter Record functions ‒ QlikView
- Mark as New
- Bookmark
- Subscribe
- Mute
- Subscribe to RSS Feed
- Permalink
- Report Inappropriate Content
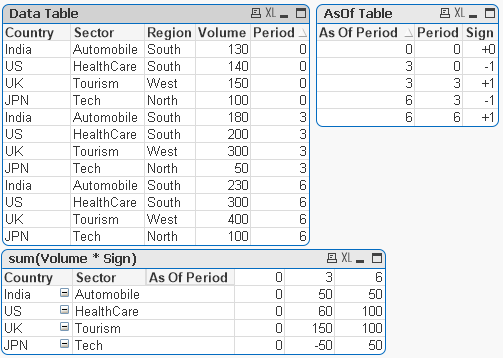
Perhaps generate an AsOf table?
As Of Period,Period,Sign
3,0,-1
3,3,+1
6,3,-1
6,6,+1
Use As Of Period as the dimension instead of period, then this expression:
sum(Volume * Sign)
- Mark as New
- Bookmark
- Subscribe
- Mute
- Subscribe to RSS Feed
- Permalink
- Report Inappropriate Content
Thanks John,
Can you please elaborate it for me. I am not able to get it.
- Mark as New
- Bookmark
- Subscribe
- Mute
- Subscribe to RSS Feed
- Permalink
- Report Inappropriate Content
See below and attached. I did have to add one more row to the AsOf table to get zeros in your first column. Without it there was no link to the data at all, so the total was null intead of zero. Please let me know if you need further elaboration on how it's doing what it's doing.
[AsOf]:
LOAD num(fieldvalue('Period',recno())) as [Period]
AUTOGENERATE fieldvaluecount('Period')
;
LEFT JOIN ([AsOf])
LOAD [Period] as [As Of Period]
RESIDENT [AsOf]
;
INNER JOIN ([AsOf])
LOAD *
,if([As Of Period]=0,0,if([As Of Period] = [Period],+1,-1)) as [Sign]
RESIDENT [AsOf]
WHERE match([As Of Period] - [Period],0,3)
;
- Mark as New
- Bookmark
- Subscribe
- Mute
- Subscribe to RSS Feed
- Permalink
- Report Inappropriate Content
Thanks John,
Implemented this solution, seems to work for calculating the difference of volumes. But I also have to show sum(volumes) across periods and their difference. If I use the As of Period as dim, I think I will not get correct results for Sum(Volume)
| Country | Sector | Metric | Q0 | Q1 (Q1-Q0) | Q2 (Q2-Q1 |
| India | Automobile | Difference based on quarters | 0 | 180-130 | 230-180 |
| Automobile | Sum(Volume) | 130 | 180 | 230 | |
| US | HealthCare | Difference based on quarters | 0 | 200-140 | 300-200 |
| HealthCare | Sum(Volume) | 140 | 200 | 300 |
- Mark as New
- Bookmark
- Subscribe
- Mute
- Subscribe to RSS Feed
- Permalink
- Report Inappropriate Content
You are right that you would not get correct results for sum(Volume). There are plenty of ways to fix it, but to stay consistent with what we're doing so far, instead of having a single sign, we could have a difference sign and a current sign. I can't modify the example from home, but something like this:
,if([As Of Period] = [Period],+1,0) as CurrSign
As Of Period, Period, DiffSign, CurrSign
0,0,0,+1
3,0,-1,0
3,3,+1,+1
6,3,-1,0
6,6,+1,+1
Difference Based on Quarters = sum(Volume * DiffSign)
Current Quarter = sum(Volume * CurrSign)
- Mark as New
- Bookmark
- Subscribe
- Mute
- Subscribe to RSS Feed
- Permalink
- Report Inappropriate Content
And chart inter-record functions would mostly work, and be simpler. I try to avoid them myself because, in this case for instance, I would want the difference to be correct even if the previous quarter is not currently selected. There are downsides to AsOf tables as well, though, such as user confusion about what is being selected when there are two different Period fields, and of course the script and data model complexity.
- Mark as New
- Bookmark
- Subscribe
- Mute
- Subscribe to RSS Feed
- Permalink
- Report Inappropriate Content
Thanks a lot, Still I have a doubt,if I use As of Period instead of Period as my dimension in the chart, wont it show incorrect data when a user will want to see the values against the periods. I want to have a list box in the report having Periods as filter. For instance my as of period is 3 where as quarter in 0.
It is possible to get the results in front end without selecting the prior period and yet getting the result in chart?
Thanks a lot for your insight..
- « Previous Replies
-
- 1
- 2
- Next Replies »