Unlock a world of possibilities! Login now and discover the exclusive benefits awaiting you.
- Qlik Community
- :
- All Forums
- :
- QlikView App Dev
- :
- Re: Giving option to select by count
- Subscribe to RSS Feed
- Mark Topic as New
- Mark Topic as Read
- Float this Topic for Current User
- Bookmark
- Subscribe
- Mute
- Printer Friendly Page
- Mark as New
- Bookmark
- Subscribe
- Mute
- Subscribe to RSS Feed
- Permalink
- Report Inappropriate Content
Giving option to select by count
Hi folks,
I have a similar straight-table as below, derived from multiple tables (as Customers, Orders, shipments). All fields in straight table has duplicates.
ORDERED_QTY is an Expression with Count function.
and remaining fields are Dimensions.
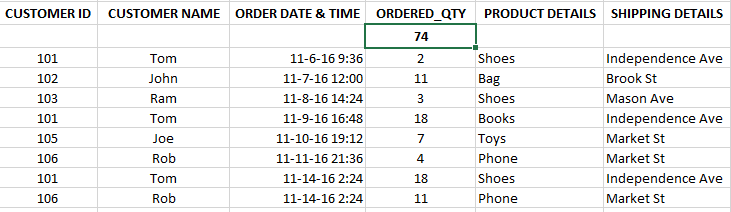
And Business user requirement is "For a given time period provide the ability to view details broken out by number as ORDERED_QTY>5 or 10, depends on user input".
Could someone please help me how to implement this in dashboard.
I tried implementing this by giving an "Multibox" option with the below similar expression
=Aggr( count(QTY), CUSTOMER_ID, CUSTOMER_NAME, ORDER_DATE_TIME, PRODUCT_DETAILS, SHIPPING_DETAILS)
but this results in a weird way as If I select Count 10, it is showing some extra values less than and greater than 10.
- Mark as New
- Bookmark
- Subscribe
- Mute
- Subscribe to RSS Feed
- Permalink
- Report Inappropriate Content
Hi,
You can achive this using a variable OR Two variables to hold and store the lower and upper bounds of the values.
Check the sample app attached and hopefully it will help you...
* On the chart properties > Expressions - Notice that "Total Mode" is Sum of Rows *
- Mark as New
- Bookmark
- Subscribe
- Mute
- Subscribe to RSS Feed
- Permalink
- Report Inappropriate Content
Try as listbox-expression something like this:
class(aggr(sum(QTY),
CUSTOMER_ID /* maybe some more dimensions like PRODUCT_DETAILS but surely not all dimensions */),
$(vQTYBucketSize))
and providing the variable vQTYBucketSize within a inputbox.
- Marcus
- Mark as New
- Bookmark
- Subscribe
- Mute
- Subscribe to RSS Feed
- Permalink
- Report Inappropriate Content
Hi friend,
Could you please post me the logic you used in QVW file, because I don't have a licensed version to open the document.
Thanks,
Ashok