Unlock a world of possibilities! Login now and discover the exclusive benefits awaiting you.
- Qlik Community
- :
- All Forums
- :
- QlikView App Dev
- :
- Graph help - MTD vs. YTD
- Subscribe to RSS Feed
- Mark Topic as New
- Mark Topic as Read
- Float this Topic for Current User
- Bookmark
- Subscribe
- Mute
- Printer Friendly Page
- Mark as New
- Bookmark
- Subscribe
- Mute
- Subscribe to RSS Feed
- Permalink
- Report Inappropriate Content
Graph help - MTD vs. YTD
Hello,
I have tried to read multiple discussion threads and I cannot seem to convert the information into what is needed. I am looking to create a graph that shows 3 years of monthly trends, and the current year's YTD trend. So far I have only been able to create the monthly trends. Here is what I am using so far
Dimensions - Month and then Year
Expressions - Sum(2015 losses)/sum(2015 premiums)
Sum(2014 losses)/sum(2014 premiums)
Sum(Plan Losses)/sum(plan premiums)
What I am trying to use for YTD incorrectly -
=(Sum ({<[MONTH-NUMERIC] = {"<=$(=max({<YEAR={$(=max(YEAR))}>} [MONTH-NUMERIC]))"}, YEAR={'2015'}>}losses)/
Sum ({< [MONTH-NUMERIC] = {"<=$(=max({<YEAR={$(=max(YEAR))}>} [MONTH-NUMERIC]))"}, YEAR={'2015'}>}[premium))
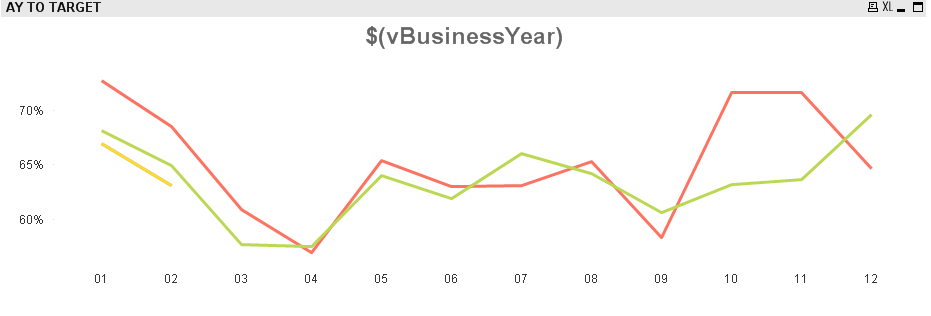
At this point my data is in Month, Year, and I have a date field I am not using currently of YYYY/MMM. I have read in several articles about a master calendar but I am not sure how to implement with just using month and year. Looking for some help in the right direction to complete the graph properly. Shown below is the graph so far, with both YTD 2015 and MTD 2015 on top of each other.
- « Previous Replies
-
- 1
- 2
- Next Replies »
Accepted Solutions
- Mark as New
- Bookmark
- Subscribe
- Mute
- Subscribe to RSS Feed
- Permalink
- Report Inappropriate Content
Check the attached file.I had to modify your expressions though. Let me know if you have any questions.
Thanks,
Amar.
- Mark as New
- Bookmark
- Subscribe
- Mute
- Subscribe to RSS Feed
- Permalink
- Report Inappropriate Content
use this for you expression
=(Sum ({<[MONTH-NUMERIC] = {"<=$(=max([MONTH-NUMERIC] ))"}, YEAR={'2015'}>}losses)
I am assuming you were trying to use the max month numeric, right ?
- Mark as New
- Bookmark
- Subscribe
- Mute
- Subscribe to RSS Feed
- Permalink
- Report Inappropriate Content
Ramon,
Thank you for the help. I was looking to plot year to date for each month. So for Jan it would only be the Jan numbers for the YTD. For Feb it would be a blend of both Feb and Jan. Will this new set analysis achieve this?
- Mark as New
- Bookmark
- Subscribe
- Mute
- Subscribe to RSS Feed
- Permalink
- Report Inappropriate Content
you can use full accumulation under expression
- Mark as New
- Bookmark
- Subscribe
- Mute
- Subscribe to RSS Feed
- Permalink
- Report Inappropriate Content
Ramon,
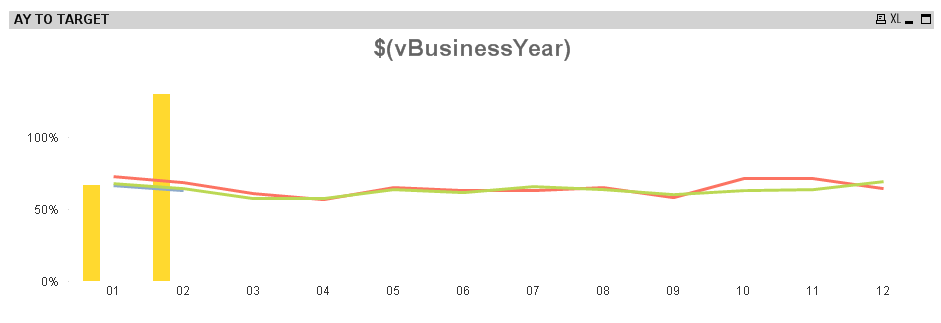
When I do the full accumulation the expression does not behave normally. The results should be between 70% and 60% and with full accumulation for the YTD it goes into the 130% range with the following picture:
- Mark as New
- Bookmark
- Subscribe
- Mute
- Subscribe to RSS Feed
- Permalink
- Report Inappropriate Content
can you share some of the data
- Mark as New
- Bookmark
- Subscribe
- Mute
- Subscribe to RSS Feed
- Permalink
- Report Inappropriate Content
Ramon,
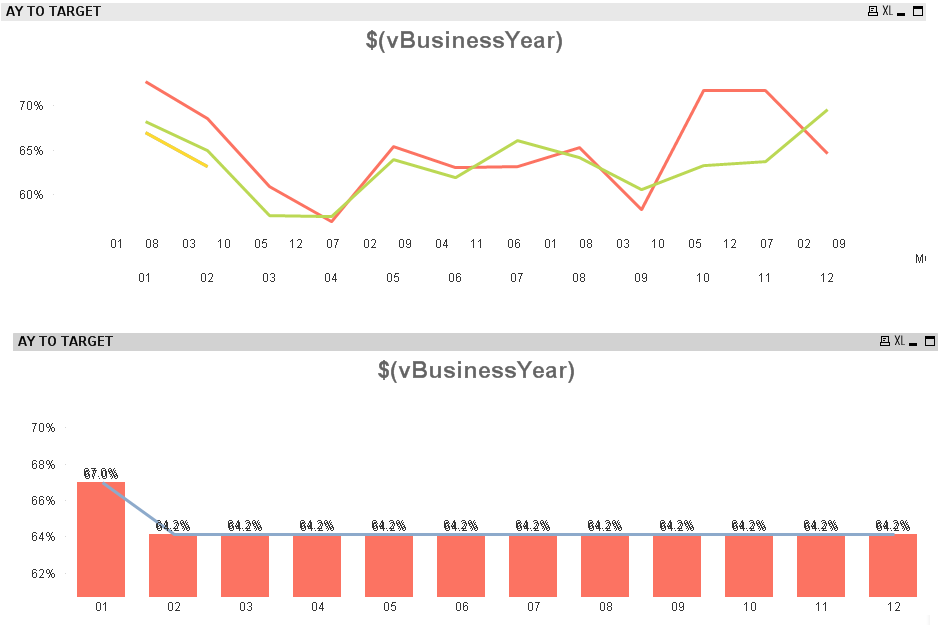
Attached is my QVW file. Month two for the year to date should come out to 64.2%.
Thank you for the help,
Justin
- Mark as New
- Bookmark
- Subscribe
- Mute
- Subscribe to RSS Feed
- Permalink
- Report Inappropriate Content
Maybe another way to do is create another field i.e. "as of" month. See the attached file. Not a complete solution, just another approach.
Thanks,
- Mark as New
- Bookmark
- Subscribe
- Mute
- Subscribe to RSS Feed
- Permalink
- Report Inappropriate Content
Amarbogam,
Thank you for the help. On the update, how would I add in the YTD field to the first graph? Also, I would like to only show through Feb on the YTD graph. When I just try to add it to the first graph, it does show properly. It shows as follows:
I would like to have the bar graph below only through February, added to the top graph if possible.
Thank you,
Justin
- Mark as New
- Bookmark
- Subscribe
- Mute
- Subscribe to RSS Feed
- Permalink
- Report Inappropriate Content
Check the attached file.I had to modify your expressions though. Let me know if you have any questions.
Thanks,
Amar.
- « Previous Replies
-
- 1
- 2
- Next Replies »