Unlock a world of possibilities! Login now and discover the exclusive benefits awaiting you.
- Qlik Community
- :
- All Forums
- :
- QlikView App Dev
- :
- Re: Graph
- Subscribe to RSS Feed
- Mark Topic as New
- Mark Topic as Read
- Float this Topic for Current User
- Bookmark
- Subscribe
- Mute
- Printer Friendly Page
- Mark as New
- Bookmark
- Subscribe
- Mute
- Subscribe to RSS Feed
- Permalink
- Report Inappropriate Content
Graph

My graph has 12 months data and no blanks.
The dimension I have used is month and this is one of the key common variables (as I have loaded in 17 excel files).
All files are from March to Feb with no blanks so I don't understand why I am getting the extra data point after feb?
Can anyone help me with this please?
Accepted Solutions
- Mark as New
- Bookmark
- Subscribe
- Mute
- Subscribe to RSS Feed
- Permalink
- Report Inappropriate Content
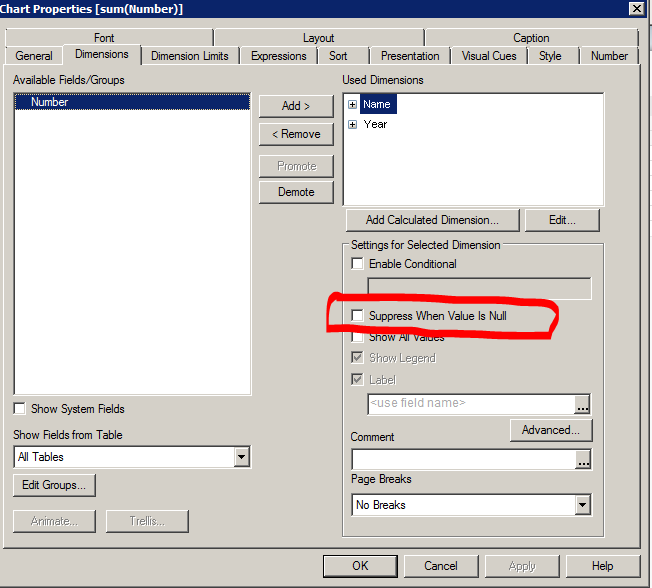
In dimension tab of your chart please check option suppress when value is null
- Mark as New
- Bookmark
- Subscribe
- Mute
- Subscribe to RSS Feed
- Permalink
- Report Inappropriate Content
can you convert that into stright table /pivot table and see which row/column showing null
- Mark as New
- Bookmark
- Subscribe
- Mute
- Subscribe to RSS Feed
- Permalink
- Report Inappropriate Content
In dimension tab of your chart please check option suppress when value is null
- Mark as New
- Bookmark
- Subscribe
- Mute
- Subscribe to RSS Feed
- Permalink
- Report Inappropriate Content
Just figured it out and did this.
Thank you
- Mark as New
- Bookmark
- Subscribe
- Mute
- Subscribe to RSS Feed
- Permalink
- Report Inappropriate Content
Hi Sarah,
The expected reason is, when you join with multiple data sources, we will get this kind of data discrepancy. To resolve that,
In dimensions, Kindly checkmark the 'Suppress When Value is null" as shown in below snapshot.