Unlock a world of possibilities! Login now and discover the exclusive benefits awaiting you.
- Qlik Community
- :
- All Forums
- :
- QlikView App Dev
- :
- Graphic Help
- Subscribe to RSS Feed
- Mark Topic as New
- Mark Topic as Read
- Float this Topic for Current User
- Bookmark
- Subscribe
- Mute
- Printer Friendly Page
- Mark as New
- Bookmark
- Subscribe
- Mute
- Subscribe to RSS Feed
- Permalink
- Report Inappropriate Content
Graphic Help
Hi!
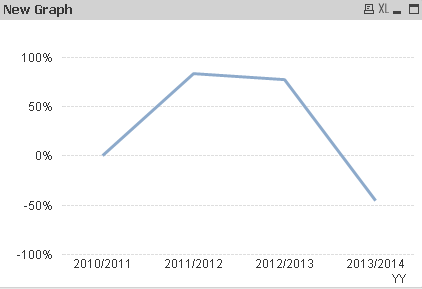
I'm trying to create a graphic of trend of costs in each year, where:
1. Total costs in 2011 is my reference line;
2. Y-axis shows percentage values from -100% to +100%, and total costs in 2011 value line starts from 0%;
3. On the total costs in 2012 line should be in evidence of the difference in percentage of total costs in 2011;
4. On the total costs in 2013 line should be in evidence of the difference in percentage of total costs in 2011;
Can you maybe help me with the example attached?
Thank you for any help ou can provide in this situation.
Regards,
Andrea
- Tags:
- new_to_qlikview
- « Previous Replies
-
- 1
- 2
- Next Replies »
Accepted Solutions
- Mark as New
- Bookmark
- Subscribe
- Mute
- Subscribe to RSS Feed
- Permalink
- Report Inappropriate Content
You would want to create a new field in your script like:
(year(addmonths(makedate(year,month),2))-1)& '/' & year(addmonths(makedate(year,month),2)) as YY
Then use that as only dimension with an expression like:
(sum({<month= {1,2,3,11,12}>}cost)
-Sum({<YY={'2010/2011'},month= {1,2,3,11,12}>}total cost))
/Sum({<YY={'2010/2011'},month= {1,2,3,11,12}>}total cost)
Please find attached for an example.
Hope this helps!
- Mark as New
- Bookmark
- Subscribe
- Mute
- Subscribe to RSS Feed
- Permalink
- Report Inappropriate Content
Can anybody help me pls?
- Mark as New
- Bookmark
- Subscribe
- Mute
- Subscribe to RSS Feed
- Permalink
- Report Inappropriate Content
See attached qvw. Is that what you're looking for?
talk is cheap, supply exceeds demand
- Mark as New
- Bookmark
- Subscribe
- Mute
- Subscribe to RSS Feed
- Permalink
- Report Inappropriate Content
Please find attached to see if its what you are looking for. What I am guessing you want is like ((Values of 2012) - (Values of 2011))/(Values of 2011).
I created two charts, one with the y-axis untouched and the other limited to -100% to 100%. But I do have to point out that you may get values larger than 100% and smaller than -100% since its about how much larger or smaller the year is compared to 2011 (Could be 200% more than 2011 for example).
Hope this helps!
- Mark as New
- Bookmark
- Subscribe
- Mute
- Subscribe to RSS Feed
- Permalink
- Report Inappropriate Content
Thank you so much for your help!!
- Mark as New
- Bookmark
- Subscribe
- Mute
- Subscribe to RSS Feed
- Permalink
- Report Inappropriate Content
Thank you so much for your help!
- Mark as New
- Bookmark
- Subscribe
- Mute
- Subscribe to RSS Feed
- Permalink
- Report Inappropriate Content
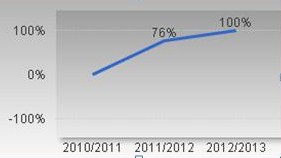
Hi! I'm trying to create a graphic as your example, but only considering these data ranges:
1) 2010/2011: date from 11/2010 to 03/2011. Is my reference line, and starts from 0%;
2) 2011/2012: from 11/2011 to 03/2012. Should be in evidence of the difference in percentage of total costs 2010/2011;
3) 2012/2013: from 11/2012 to 03/2013.Should be in evidence of the difference in percentage of total costs 2010/2011;
The result should be something as this graphic:
Could you help me to write the expression pls?
I tried to use something like this:
(sum({<year={2011}, month= {’11’,’12’}>+<{<year={2012}, month= {’1’,’2’,’3’}>}cost)
-Sum({<year={2010}, month= {’11’,’12’}>+<{<year={2011}, month= {’1’,’2’,’3’}>} cost))
/Sum({<year={2011}, month= {’11’,’12’}>+<{<year={2012}, month= {’1’,’2’,’3’}>}cost)
But I don't know how to insert all range data options.
I really appreciate any help you can provide.
Regards,
Andrea
- Mark as New
- Bookmark
- Subscribe
- Mute
- Subscribe to RSS Feed
- Permalink
- Report Inappropriate Content
You would want to create a new field in your script like:
(year(addmonths(makedate(year,month),2))-1)& '/' & year(addmonths(makedate(year,month),2)) as YY
Then use that as only dimension with an expression like:
(sum({<month= {1,2,3,11,12}>}cost)
-Sum({<YY={'2010/2011'},month= {1,2,3,11,12}>}total cost))
/Sum({<YY={'2010/2011'},month= {1,2,3,11,12}>}total cost)
Please find attached for an example.
Hope this helps!
- Mark as New
- Bookmark
- Subscribe
- Mute
- Subscribe to RSS Feed
- Permalink
- Report Inappropriate Content
Hi Jerem! Thank you so much for help!!
I have some problems to create a new field. If I use an expression like this as Dimension:
If(([Year] = 2010 and ([Month]= 11 or [Month]= 12)) or ([Year] = 2011 and ([Month= 1 or [Month]= 2 or [Month]= 3)),'2010/2011',
If (([Year] = 2011 and ([Month]= 11 or [Month]= 12)) or ([Year] = 2012 and ([Month]= 1 or [Month]= 2 or [Month]= 3)),'2011/2012',
If (([Year] = 2012 and ([Month]= 11 or [Month= 12)) or ([Year] = 2013 and ([Month]= 1 or [Month]= 2 or [Month]= 3)),'2012/2013')))
Do you think there is another way to write the expression?
I will be grateful if you can send me this information.
Regards,
Andrea
- Mark as New
- Bookmark
- Subscribe
- Mute
- Subscribe to RSS Feed
- Permalink
- Report Inappropriate Content
What's the problem with making extra field? If the problem is adding to script, then maybe adding the calculated dimension with same thing would do it?
=(year(addmonths(makedate(year,month),2))-1)& '/' & year(addmonths(makedate(year,month),2))
as dimension and use the expression I used above.
What problems are you having creating the dimension?
- « Previous Replies
-
- 1
- 2
- Next Replies »