Unlock a world of possibilities! Login now and discover the exclusive benefits awaiting you.
- Qlik Community
- :
- All Forums
- :
- QlikView App Dev
- :
- Re: Group dimension in chart / Duration chart
Options
- Subscribe to RSS Feed
- Mark Topic as New
- Mark Topic as Read
- Float this Topic for Current User
- Bookmark
- Subscribe
- Mute
- Printer Friendly Page
Turn on suggestions
Auto-suggest helps you quickly narrow down your search results by suggesting possible matches as you type.
Showing results for
Anonymous
Not applicable
2018-05-08
08:06 AM
- Mark as New
- Bookmark
- Subscribe
- Mute
- Subscribe to RSS Feed
- Permalink
- Report Inappropriate Content
Group dimension in chart / Duration chart
Hi,
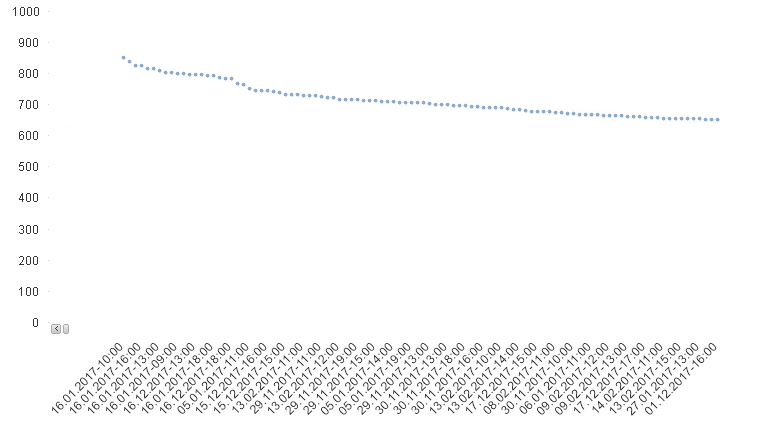
I have around 8 760 values within a year, i need to group it from max value - low value by thousands like in the chart below.
expression: sum(value)
Dimension: [Date-Time]
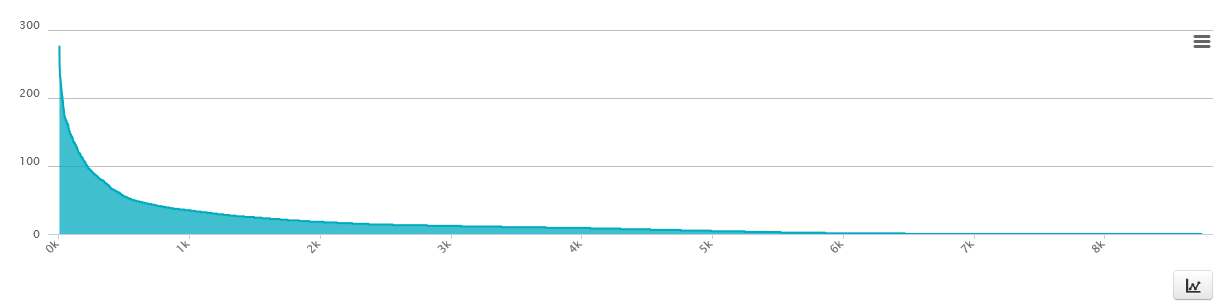
Can anybody help me to turn this chart:
to this:
2,084 Views
- « Previous Replies
-
- 1
- 2
- Next Replies »
13 Replies
2018-05-08
09:08 AM
- Mark as New
- Bookmark
- Subscribe
- Mute
- Subscribe to RSS Feed
- Permalink
- Report Inappropriate Content
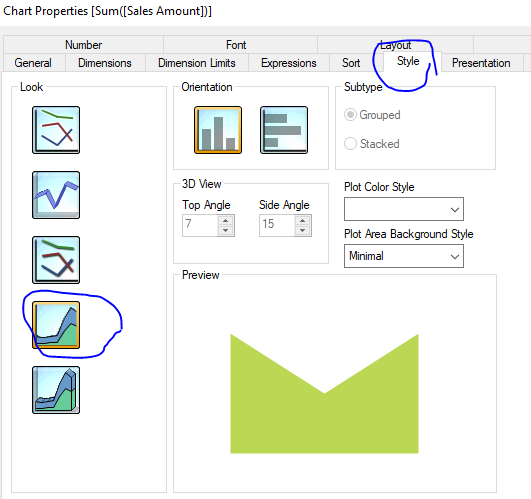
Perhaps this?
Best Anil, When applicable please mark the correct/appropriate replies as "solution" (you can mark up to 3 "solutions". Please LIKE threads if the provided solution is helpful
528 Views
Master II
2018-05-08
09:14 AM
- Mark as New
- Bookmark
- Subscribe
- Mute
- Subscribe to RSS Feed
- Permalink
- Report Inappropriate Content
You can do step by 1000 and avoid the if condition in the dimension.
Best Regards,
KC
KC
528 Views
MVP
2018-05-08
05:43 PM
- Mark as New
- Bookmark
- Subscribe
- Mute
- Subscribe to RSS Feed
- Permalink
- Report Inappropriate Content
Hi,
maybe one solution could be:
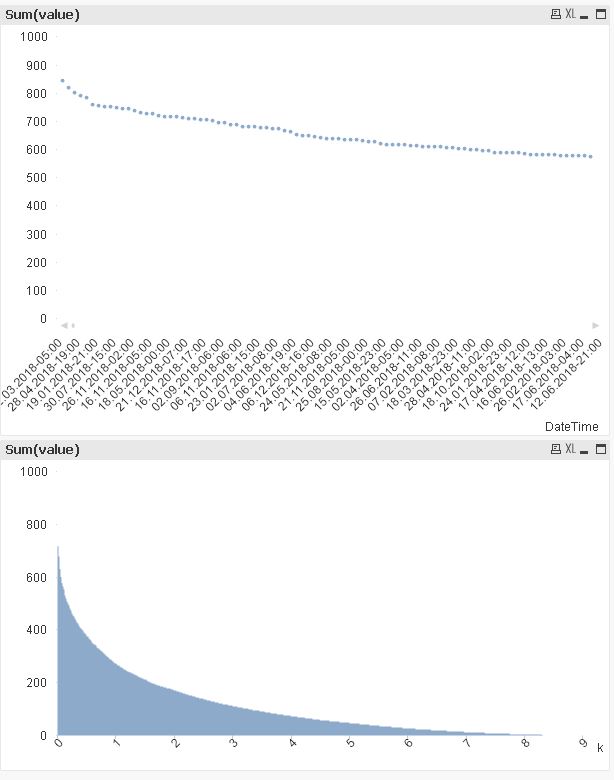
hope this helps
regards
Marco
Anonymous
Not applicable
2018-05-15
09:23 AM
Author
- Mark as New
- Bookmark
- Subscribe
- Mute
- Subscribe to RSS Feed
- Permalink
- Report Inappropriate Content
Thank you! wokrs perfect 🙂
- « Previous Replies
-
- 1
- 2
- Next Replies »