Unlock a world of possibilities! Login now and discover the exclusive benefits awaiting you.
- Qlik Community
- :
- All Forums
- :
- QlikView App Dev
- :
- Re: Grouping data
- Subscribe to RSS Feed
- Mark Topic as New
- Mark Topic as Read
- Float this Topic for Current User
- Bookmark
- Subscribe
- Mute
- Printer Friendly Page
- Mark as New
- Bookmark
- Subscribe
- Mute
- Subscribe to RSS Feed
- Permalink
- Report Inappropriate Content
Grouping data
Hello everyone,
I've got some data where there are 4 categories but want them to be split into 3 per category when reporting in Qlikview. The four categories are as follows:
EAD
CAD
FRT
EPD
I have the type of products
Apples
Grapes
Pears
Bananas
Carrots
Peas
Peppers
Beef
Sausage
Lamb
Chicken
Eggs
I would like the categories to be:
EAD - Fruit
EAD - Veg
CAD - Fruit
CAD - Veg
FRT - Meat
FRT - Veg
EPD - Meat
EPD - Fruit
EPD - Veg
ect....
I've created a table where the categories should match the product
| Category | Product | New Category |
| EAD | Apples | EAD - Fruit |
| EAD | Grapes | EAD - Fruit |
| EAD | Pears | EAD - Fruit |
| EAD | Bananas | EAD - Fruit |
| EAD | Carrots | EAD - Veg |
| EAD | Peas | EAD - Veg |
| EAD | Peppers | EAD - Veg |
| EAD | Beef | EAD - Meat |
| EAD | Sausage | EAD - Meat |
| EAD | Lamb | EAD - Meat |
| EAD | Chicken | EAD - Meat |
| EAD | Eggs | EAD - Meat |
| CAD | Apples | CAD - Fruit |
| CAD | Grapes | CAD - Fruit |
| CAD | Pears | CAD - Fruit |
| CAD | Bananas | CAD - Fruit |
| CAD | Carrots | CAD - Veg |
| CAD | Peas | CAD - Veg |
| CAD | Peppers | CAD - Veg |
| CAD | Beef | CAD - Meat |
| CAD | Sausage | CAD - Meat |
| CAD | Lamb | CAD - Meat |
| CAD | Chicken | CAD - Meat |
| CAD | Eggs | CAD - Meat |
ect....
so instead of getting a total I can break it down in to 'new categories' I have done this but I still get the total of EAD and not the individual total of EAD.
I have the dimension of New category and the expression of =sum(amount) thinking that it would total all the new categories but does not.
hopefully someone could help and sorry if I have made it more complicated than it sounds...
- Tags:
- new_to_qlikview
- Mark as New
- Bookmark
- Subscribe
- Mute
- Subscribe to RSS Feed
- Permalink
- Report Inappropriate Content
Hi, Not able to understand your problem.. Could repharse your question.
- Sridhar
- Mark as New
- Bookmark
- Subscribe
- Mute
- Subscribe to RSS Feed
- Permalink
- Report Inappropriate Content
Hi,
You "Amount" field is in which table. Same table or some other table?
some other table means What is the link field for that table?
Better can u attach yr application are give me clear picture?
-Sathish
- Mark as New
- Bookmark
- Subscribe
- Mute
- Subscribe to RSS Feed
- Permalink
- Report Inappropriate Content
Hi,
This seems to complex to discribe and due to the data protection act I cannot upload the file. It has customer details in. Thanks for your help though
- Mark as New
- Bookmark
- Subscribe
- Mute
- Subscribe to RSS Feed
- Permalink
- Report Inappropriate Content
you scramble you data or send us your sample data with your output
- Mark as New
- Bookmark
- Subscribe
- Mute
- Subscribe to RSS Feed
- Permalink
- Report Inappropriate Content
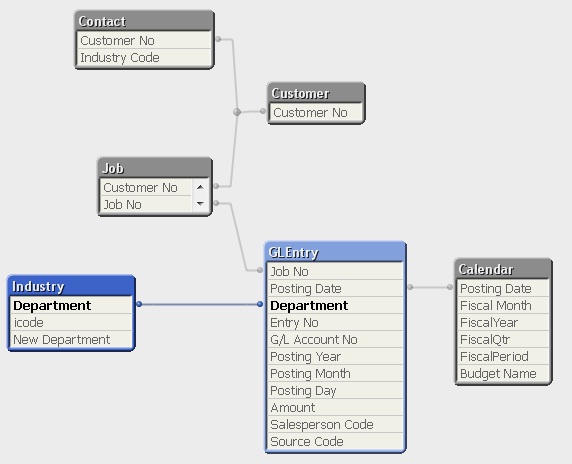
How this new category is associated with the other tables?
- Mark as New
- Bookmark
- Subscribe
- Mute
- Subscribe to RSS Feed
- Permalink
- Report Inappropriate Content
Hey Hi,
Please find the attached application for your solution.
Hope this solves your problem.
Regards
- Mark as New
- Bookmark
- Subscribe
- Mute
- Subscribe to RSS Feed
- Permalink
- Report Inappropriate Content
Thank you very much for your help. it is a little more complex than this. i'm trying to create an example, please bear with me. once i've got it sorted. i'll show you. In a way it works but I would like the results displayed in a straight table.
- Mark as New
- Bookmark
- Subscribe
- Mute
- Subscribe to RSS Feed
- Permalink
- Report Inappropriate Content

This is the relationship between the tables, you can see the amount is in a different table to the new department.
In a straight table can you create more than one calculation? e.g. sum(amount) and the average below the sum