Unlock a world of possibilities! Login now and discover the exclusive benefits awaiting you.
- Qlik Community
- :
- All Forums
- :
- QlikView App Dev
- :
- Re: Grouping dimensions similar to pivot table gro...
- Subscribe to RSS Feed
- Mark Topic as New
- Mark Topic as Read
- Float this Topic for Current User
- Bookmark
- Subscribe
- Mute
- Printer Friendly Page
- Mark as New
- Bookmark
- Subscribe
- Mute
- Subscribe to RSS Feed
- Permalink
- Report Inappropriate Content
Grouping dimensions similar to pivot table grouping
Hi guys.
I have 2 parameters "coverage days"-dimension and "stock available"-expression for which i am trying to make a graph.
When i am doing in excel vlookup, i am able to Group it as excel vlookup has the functionality to group when we right click the pivot table. and i can generate graph like below where i have group the stock availability based on coverage days from 0-9 days as 1st group, 10-19days as 2nd group etc.
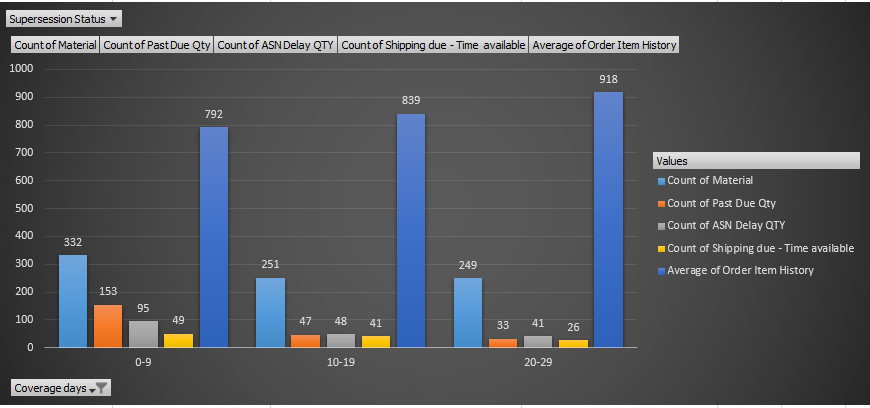
One good thing with pivot table is that, it selects the minimum value and maximum value for grouping and we have to give the step value for example 10.
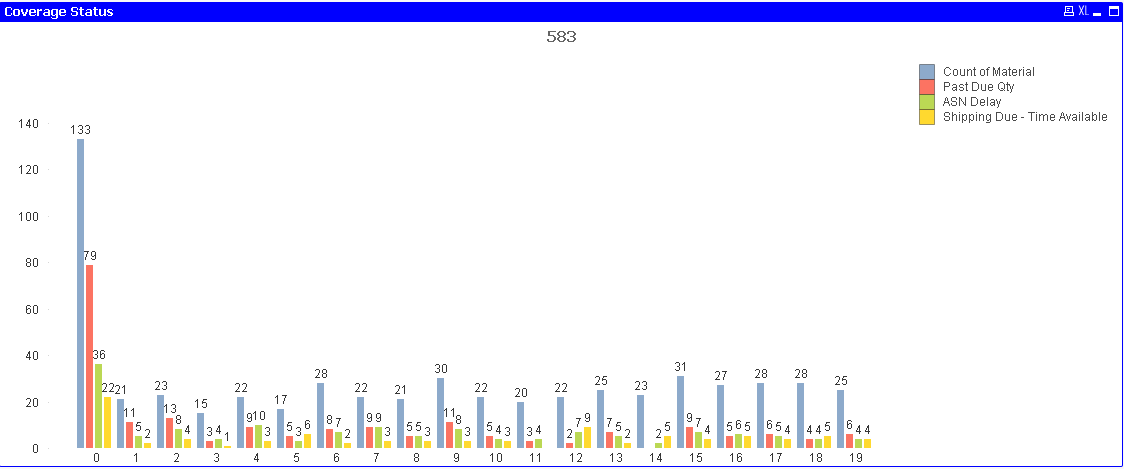
But i cannot do this grouping qlikview. I need your help to achieve this. Below is my qlikview try for this.
Also, how much ever i try, i am not able to place the expression label horizontally on top by moving SHIFT+CTRL so that i can widen the graph. But i am not able to achieve this as well. Any good way to solve both these problem? pls helpl
Accepted Solutions
- Mark as New
- Bookmark
- Subscribe
- Mute
- Subscribe to RSS Feed
- Permalink
- Report Inappropriate Content
Hi,
you could use something like
Class([coverage days],10)
as calculated dimension.
hope this helps
regards
Marco
- Mark as New
- Bookmark
- Subscribe
- Mute
- Subscribe to RSS Feed
- Permalink
- Report Inappropriate Content
Hi,
you could use something like
Class([coverage days],10)
as calculated dimension.
hope this helps
regards
Marco
- Mark as New
- Bookmark
- Subscribe
- Mute
- Subscribe to RSS Feed
- Permalink
- Report Inappropriate Content
Wow. It worked. Awesome. Thank you so much Marco Wedel 