Unlock a world of possibilities! Login now and discover the exclusive benefits awaiting you.
- Qlik Community
- :
- All Forums
- :
- QlikView App Dev
- :
- Grouping in bar chart
- Subscribe to RSS Feed
- Mark Topic as New
- Mark Topic as Read
- Float this Topic for Current User
- Bookmark
- Subscribe
- Mute
- Printer Friendly Page
- Mark as New
- Bookmark
- Subscribe
- Mute
- Subscribe to RSS Feed
- Permalink
- Report Inappropriate Content
Grouping in bar chart
Hi Guys,
I am stuck here...Please help me with the below mentioned query.
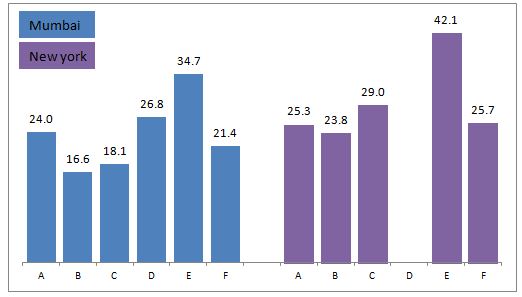
I have a table
| Country | Type | Points |
| Mumbai | A | 24.0 |
| Mumbai | B | 16.6 |
| Mumbai | C | 18.1 |
| Mumbai | D | 26.8 |
| Mumbai | E | 34.7 |
| Mumbai | F | 21.4 |
| New york | A | 25.3 |
| New york | B | 23.8 |
| New york | C | 29.0 |
| New york | D | |
| New york | E | 42.1 |
| New york | F | 25.7 |
So i need to create a bar chart which should look like this
I have following challenges:
1. I need the bars to be in group, i.e first mumbai and new york, which is possible, but i am getting all in different color bars identified by the types.
2. Between the two group sets of bars, i need a space in between, which i got here as this is taken from excel.
3. By any chance can i make a flip option, where i can select only mumbai or new york and its data should appear.
Thanks in advance!
Regards,
Kuldeep
- Tags:
- new_to_qlikview
- « Previous Replies
-
- 1
- 2
- Next Replies »
Accepted Solutions
- Mark as New
- Bookmark
- Subscribe
- Mute
- Subscribe to RSS Feed
- Permalink
- Report Inappropriate Content
- Mark as New
- Bookmark
- Subscribe
- Mute
- Subscribe to RSS Feed
- Permalink
- Report Inappropriate Content
- Mark as New
- Bookmark
- Subscribe
- Mute
- Subscribe to RSS Feed
- Permalink
- Report Inappropriate Content
Hi Kuldeep,
see the attached example
Andy
- Mark as New
- Bookmark
- Subscribe
- Mute
- Subscribe to RSS Feed
- Permalink
- Report Inappropriate Content
see attached
- Mark as New
- Bookmark
- Subscribe
- Mute
- Subscribe to RSS Feed
- Permalink
- Report Inappropriate Content
Friends,
Cant see the attachments 
- Mark as New
- Bookmark
- Subscribe
- Mute
- Subscribe to RSS Feed
- Permalink
- Report Inappropriate Content
Are you using personal edition or a full license of QV?
- Mark as New
- Bookmark
- Subscribe
- Mute
- Subscribe to RSS Feed
- Permalink
- Report Inappropriate Content
Full licensed version
- Mark as New
- Bookmark
- Subscribe
- Mute
- Subscribe to RSS Feed
- Permalink
- Report Inappropriate Content
I think you are opening this thread from inbox or notification.
Click on the Subject : Grouping in bar chart and then check, if you are not able to see the attachment. Because attachment is there.
- Mark as New
- Bookmark
- Subscribe
- Mute
- Subscribe to RSS Feed
- Permalink
- Report Inappropriate Content
Oh yes, i am sorry folks..will check and get back to you...Thanks!
- Mark as New
- Bookmark
- Subscribe
- Mute
- Subscribe to RSS Feed
- Permalink
- Report Inappropriate Content
Hello Kuldeep,
You can do the following way. You can use Alerts for Text/Button objects.basedon the button selection you can show the Expressions on Chart layout.usethe conditions on Expressions.
I hope this idea will help you.
Let me know if you need any help.
Thanks
San
- « Previous Replies
-
- 1
- 2
- Next Replies »