Unlock a world of possibilities! Login now and discover the exclusive benefits awaiting you.
- Qlik Community
- :
- All Forums
- :
- QlikView App Dev
- :
- Re: HOw to show a dot at all curves in line chart ...
- Subscribe to RSS Feed
- Mark Topic as New
- Mark Topic as Read
- Float this Topic for Current User
- Bookmark
- Subscribe
- Mute
- Printer Friendly Page
- Mark as New
- Bookmark
- Subscribe
- Mute
- Subscribe to RSS Feed
- Permalink
- Report Inappropriate Content
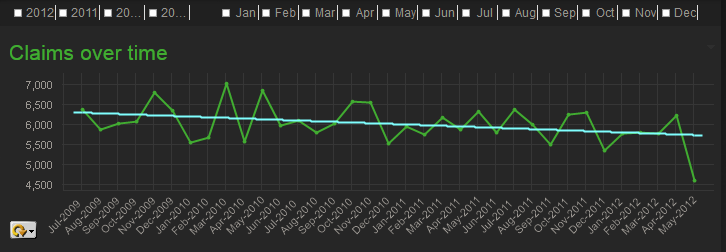
HOw to show a dot at all curves in line chart and want to show a line that show the trend from first value to last value.
HEy,
I have used a line chart but want to show a dot at all curves and want to show a line that show the trend from first value to last value. As attached in image. How can i show that ??
Thanks
- Tags:
- new_to_qlikview
- « Previous Replies
-
- 1
- 2
- Next Replies »
- Mark as New
- Bookmark
- Subscribe
- Mute
- Subscribe to RSS Feed
- Permalink
- Report Inappropriate Content
Hi
Use Trend Lines or Reference lines
- Mark as New
- Bookmark
- Subscribe
- Mute
- Subscribe to RSS Feed
- Permalink
- Report Inappropriate Content
where to find trend or reference lines and how to use it ??
- Mark as New
- Bookmark
- Subscribe
- Mute
- Subscribe to RSS Feed
- Permalink
- Report Inappropriate Content
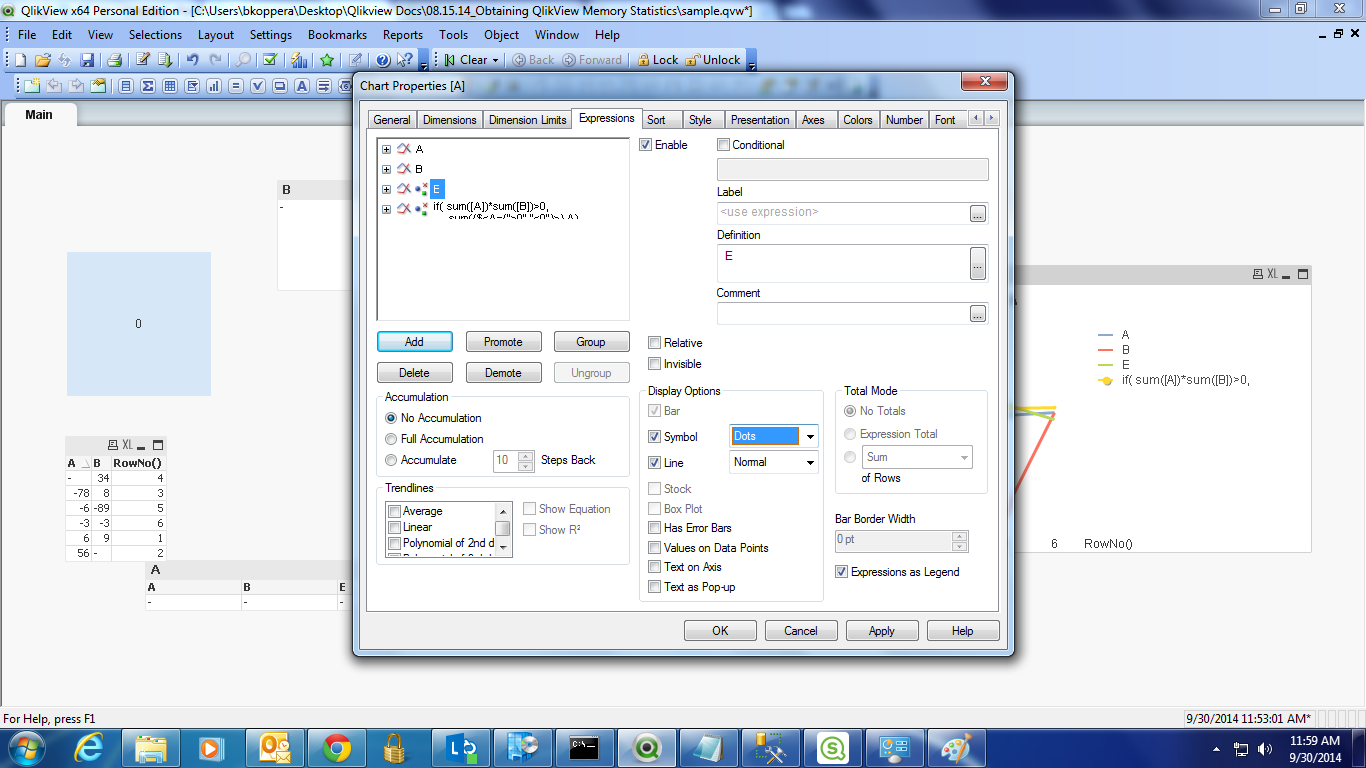
In Expression tab -- you will find Trend lines --
Predifines lines i.e Average , Linier etc..
In Presentation tab - Reference lines option is there
there you have to Add your own exp then it will display the line in chart
- Mark as New
- Bookmark
- Subscribe
- Mute
- Subscribe to RSS Feed
- Permalink
- Report Inappropriate Content
Hi,
Make sure highlighted is selected.
Have a look at attached image.
Regards
ASHFAQ
- Mark as New
- Bookmark
- Subscribe
- Mute
- Subscribe to RSS Feed
- Permalink
- Report Inappropriate Content
HEy,
Thanks but trends lines doesnot touch first value and last value ?? Does it really show the trend of values ??
- Mark as New
- Bookmark
- Subscribe
- Mute
- Subscribe to RSS Feed
- Permalink
- Report Inappropriate Content
- Mark as New
- Bookmark
- Subscribe
- Mute
- Subscribe to RSS Feed
- Permalink
- Report Inappropriate Content
Go for linier Trend line it will touch both
- Mark as New
- Bookmark
- Subscribe
- Mute
- Subscribe to RSS Feed
- Permalink
- Report Inappropriate Content
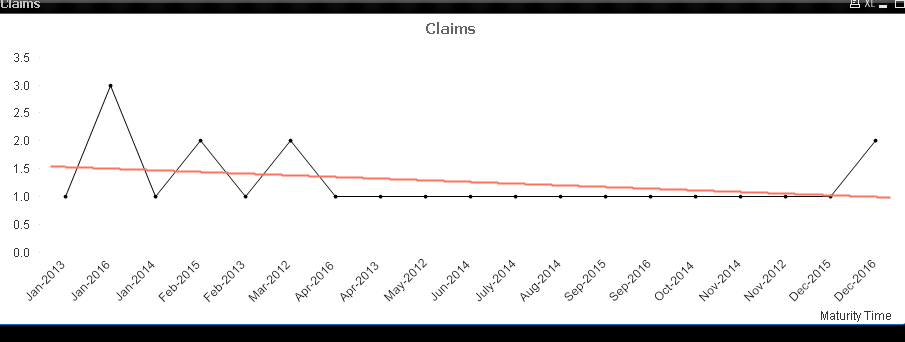
Hey,Can not we show the dots with different color ??
And i have attached a image in that , trend lines(polynomial) are used but they are not showing correct trend. How to get correct trend ??
- Mark as New
- Bookmark
- Subscribe
- Mute
- Subscribe to RSS Feed
- Permalink
- Report Inappropriate Content
Hey,Can not we show the dots with different color ??
And i have attached a image in that , trend lines(polynomial) are used but they are not showing correct trend. How to get correct trend ??
- « Previous Replies
-
- 1
- 2
- Next Replies »