Unlock a world of possibilities! Login now and discover the exclusive benefits awaiting you.
- Qlik Community
- :
- All Forums
- :
- QlikView App Dev
- :
- Help require to create Google map chart
- Subscribe to RSS Feed
- Mark Topic as New
- Mark Topic as Read
- Float this Topic for Current User
- Bookmark
- Subscribe
- Mute
- Printer Friendly Page
- Mark as New
- Bookmark
- Subscribe
- Mute
- Subscribe to RSS Feed
- Permalink
- Report Inappropriate Content
Help require to create Google map chart
Hello Forum/Expert,
I had gone through following URL "http://community.qlik.com/thread/32443"
For creation of Google Map Chart. But I could'nt grapse it out.
I don't know where following code has to past
='http://maps.google.com/staticmap?center=' & num(var_mid_lat, '##############', '.', ',' ) & ',' & num(var_mid_long, '##############', '.', ',' ) & '&zoom=$(var_zoom)' & '&maptype=' & var_maptype & '&size=' & map_size_x & 'x' & map_size_y & '&key=' & gmap_key & '&.jpg'
However, I am want to create Google Map Chart instead of normal chart. Can any body please help/guide me by providing the Simple Example of creation of Google Map Chart step by step with "Inline data" so that I can understand it.
Thanks in Advance
SS
- Tags:
- new_to_qlikview
- Mark as New
- Bookmark
- Subscribe
- Mute
- Subscribe to RSS Feed
- Permalink
- Report Inappropriate Content
you need to put it in the "color" tab of the bubble graph, in the "dynamic image" field
- Mark as New
- Bookmark
- Subscribe
- Mute
- Subscribe to RSS Feed
- Permalink
- Report Inappropriate Content
Hi Matthieu,
On your suggestion I had pasted the above script in the "color" tab of the bubble graph, in the "dynamic image" field. But I could'nt see the Map Chart. Following is the screen shot.
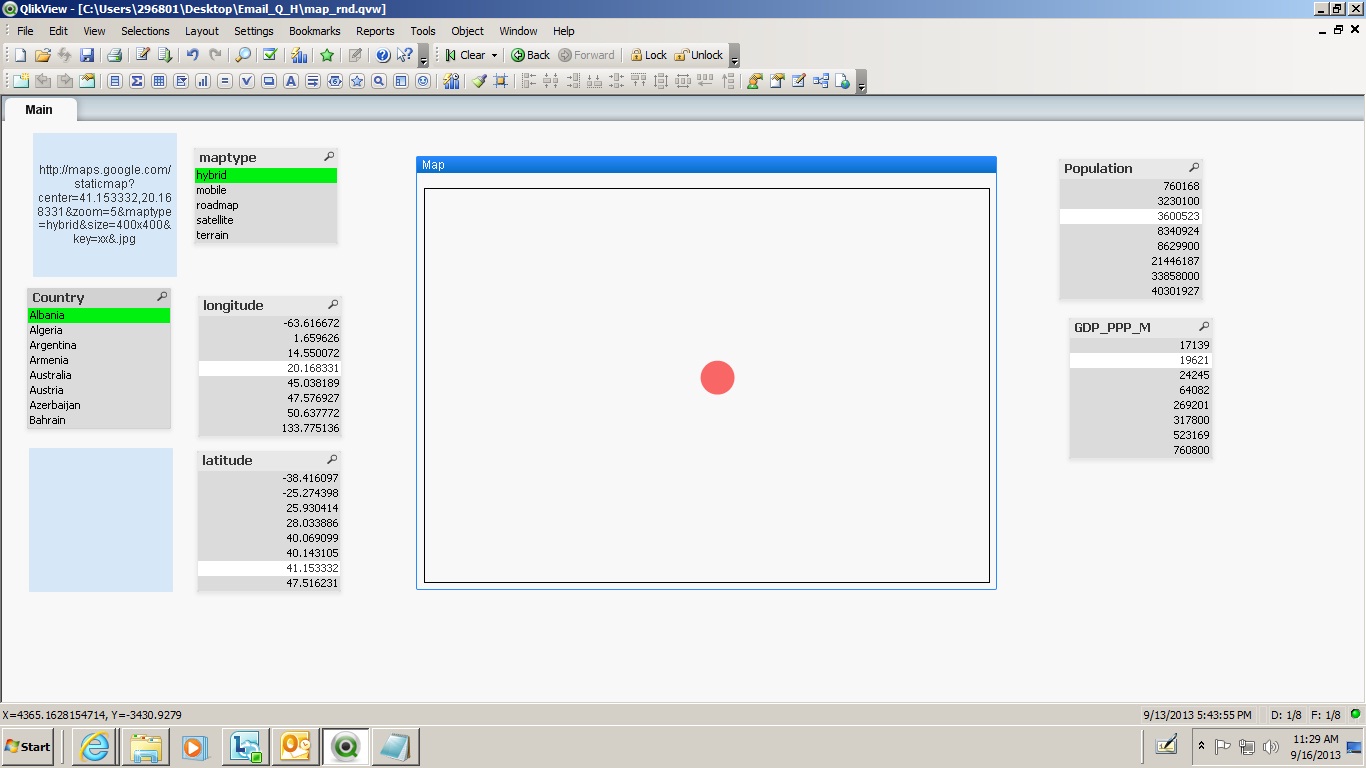
Can you please suggested what to do more? So that I can see the map instead of Bubble Chart.
Thanks in Advance