Unlock a world of possibilities! Login now and discover the exclusive benefits awaiting you.
- Qlik Community
- :
- All Forums
- :
- QlikView App Dev
- :
- Help with MoM figure
Options
- Subscribe to RSS Feed
- Mark Topic as New
- Mark Topic as Read
- Float this Topic for Current User
- Bookmark
- Subscribe
- Mute
- Printer Friendly Page
Turn on suggestions
Auto-suggest helps you quickly narrow down your search results by suggesting possible matches as you type.
Showing results for
Contributor
2018-10-01
01:12 PM
- Mark as New
- Bookmark
- Subscribe
- Mute
- Subscribe to RSS Feed
- Permalink
- Report Inappropriate Content
Help with MoM figure
Hello,
I am trying to create a table and a separate line graph to highlight MoM growth rates.
I have the below data:
OrderDate | Month# | Client | Sales
2018-03-16 3 abc123 $1,000
2018-03-18 3 xyz123 $1,500
2018-04-10 4 abc123 $2,000
2018-05-13 5 xyz123 $3,000
Total sales for March = $2,500
Total sales for April = $2,000
Total sales for May = $3,000
I would expect the first value to be null seeing as no data exists for February.
Any help would be much appreciated!
491 Views
2 Replies
MVP
2018-10-01
01:30 PM
- Mark as New
- Bookmark
- Subscribe
- Mute
- Subscribe to RSS Feed
- Permalink
- Report Inappropriate Content
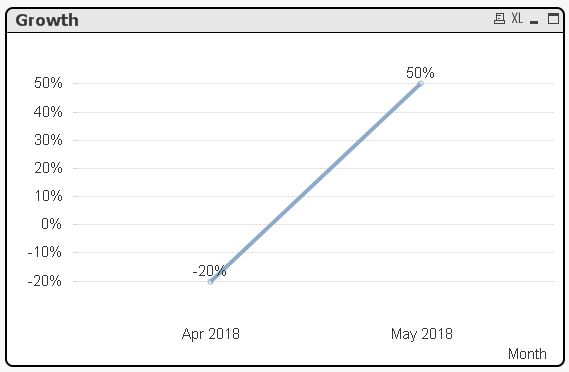
Dimension:
=MonthName(MonthStart(OrderDate))
Expression:
(sum(Sales) - above(sum(Sales)))/above(sum(Sales))
Result:
Contributor
2018-10-02
10:13 AM
Author
- Mark as New
- Bookmark
- Subscribe
- Mute
- Subscribe to RSS Feed
- Permalink
- Report Inappropriate Content
Thanks very much - worked perfectly!
451 Views