Unlock a world of possibilities! Login now and discover the exclusive benefits awaiting you.
- Qlik Community
- :
- All Forums
- :
- QlikView App Dev
- :
- Help with displaying results on Guage chart
- Subscribe to RSS Feed
- Mark Topic as New
- Mark Topic as Read
- Float this Topic for Current User
- Bookmark
- Subscribe
- Mute
- Printer Friendly Page
- Mark as New
- Bookmark
- Subscribe
- Mute
- Subscribe to RSS Feed
- Permalink
- Report Inappropriate Content
Help with displaying results on Guage chart
Hi,
I am trying to display the result as text on the bottom of a Guage chart like in the picture below (taken from a sample from QLIKVIEW.COM)
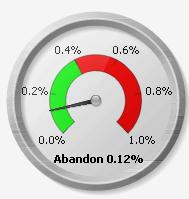
Everything i try doesnt seem to work. I have copied the settings from this example and i can only get the text to display at the top not the bottom like this one.
Can anyone help me please?
- Tags:
- new_to_qlikview
- Mark as New
- Bookmark
- Subscribe
- Mute
- Subscribe to RSS Feed
- Permalink
- Report Inappropriate Content
Select the chart. Then press ctl+shift . Then you will get redboxes inside the chart. Drag the redbox with the text and drag it down to desired place.
- Mark as New
- Bookmark
- Subscribe
- Mute
- Subscribe to RSS Feed
- Permalink
- Report Inappropriate Content
Hi there,
I tried using ctrl +shift. But that didn't work for me. I have a work around.
Just created a text object and copy the expression from the gauge chart to the text object. The text object should now display the guage results.
Now drag the text object to the gauge chart and change the background color this code:= argb(35,255,255,255) this is the same color as the gauge chart. set the transparant mode now to 100%
I know this is not the quickest way, but it works for me.
If some else has a better idea, feel free to share it.
Cheers!
- Mark as New
- Bookmark
- Subscribe
- Mute
- Subscribe to RSS Feed
- Permalink
- Report Inappropriate Content
Hi, thanks Pauljin, that worked! But do you know if there is a way to wrap the next on 2 lines?
- Mark as New
- Bookmark
- Subscribe
- Mute
- Subscribe to RSS Feed
- Permalink
- Report Inappropriate Content
Yes. Press shift + Enter to create a second line. You can also change the font size 
Hope that works
Cheers!
Ps: it’s isam not Pauljin 😛