Unlock a world of possibilities! Login now and discover the exclusive benefits awaiting you.
- Qlik Community
- :
- All Forums
- :
- QlikView App Dev
- :
- Re: Help with expression
- Subscribe to RSS Feed
- Mark Topic as New
- Mark Topic as Read
- Float this Topic for Current User
- Bookmark
- Subscribe
- Mute
- Printer Friendly Page
- Mark as New
- Bookmark
- Subscribe
- Mute
- Subscribe to RSS Feed
- Permalink
- Report Inappropriate Content
Help with expression
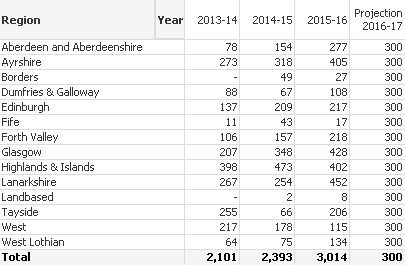
I am using the following expression to create a table showing enrolments by region and year PLUS a Projection for 2016-17
Count({$<region=>} enrolments)
& Projection
However, the table does not show a SUM total for the Projection and when I tried to add a SUM element to the expression it also changed the values for the number of actual enrolments in a Year.
I used set analysis because I wanted the table to show all the regions regardless of a user selecting a region. Instead, I have set up the table to highlight the selected region like below -
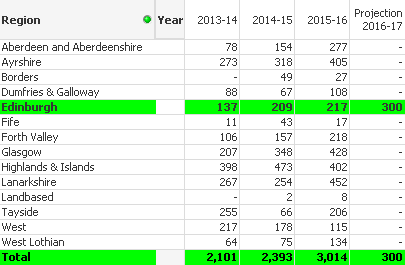
But the Projections for the regions not selected have disappeared.
Can someone help me with the expression?
Thanks
Greg
Accepted Solutions
- Mark as New
- Bookmark
- Subscribe
- Mute
- Subscribe to RSS Feed
- Permalink
- Report Inappropriate Content
Hi Greg,
Try RangeSum(Count({<region=>}enrolments),Sum(Projection))
Regards!!
- Mark as New
- Bookmark
- Subscribe
- Mute
- Subscribe to RSS Feed
- Permalink
- Report Inappropriate Content
Is it 'region' or 'Region' ? Field name is case sensitive here. Count({$<Region=>} enrolments)
- Mark as New
- Bookmark
- Subscribe
- Mute
- Subscribe to RSS Feed
- Permalink
- Report Inappropriate Content
Try using
sum(Projections)
- Mark as New
- Bookmark
- Subscribe
- Mute
- Subscribe to RSS Feed
- Permalink
- Report Inappropriate Content
Or sum({<Region=>}[Projection]) to ignore the region selection
- Mark as New
- Bookmark
- Subscribe
- Mute
- Subscribe to RSS Feed
- Permalink
- Report Inappropriate Content
Hi Greg,
Try RangeSum(Count({<region=>}enrolments),Sum(Projection))
Regards!!