Unlock a world of possibilities! Login now and discover the exclusive benefits awaiting you.
- Qlik Community
- :
- All Forums
- :
- QlikView App Dev
- :
- Re: Hide Lines in a graph chart
- Subscribe to RSS Feed
- Mark Topic as New
- Mark Topic as Read
- Float this Topic for Current User
- Bookmark
- Subscribe
- Mute
- Printer Friendly Page
- Mark as New
- Bookmark
- Subscribe
- Mute
- Subscribe to RSS Feed
- Permalink
- Report Inappropriate Content
Hide Lines in a graph chart
Hello All,
I have a requirement where i would like display the graph indicating sales of the whole country by default, and upon selection of a particular state the graph of that state should be displayed along with country graph. And at last the city graph should also be on the same lines as state graph.
Could you please provide me any pointers on doing this.
Thanks much. Wish you all a nice weekend!!
- « Previous Replies
-
- 1
- 2
- Next Replies »
Accepted Solutions
- Mark as New
- Bookmark
- Subscribe
- Mute
- Subscribe to RSS Feed
- Permalink
- Report Inappropriate Content
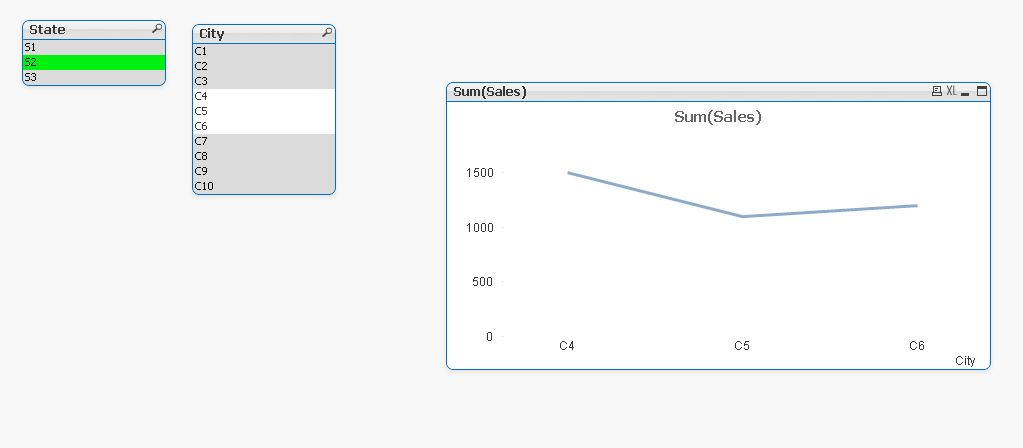
No selection-

with state selection -

with city selection-
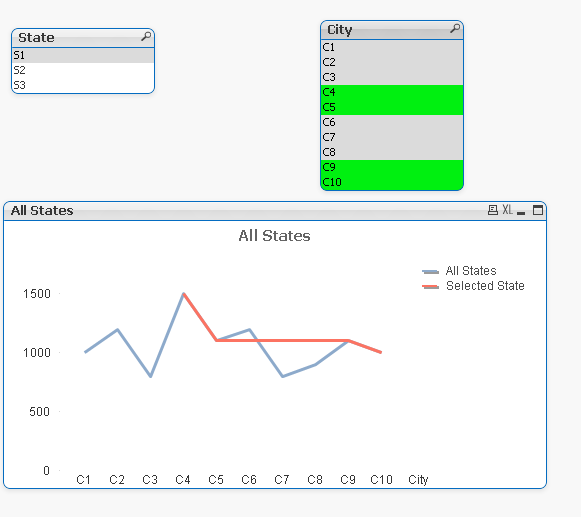
I have change it a way that when you select a state the dimensions changes to City.. if we keep it state the selected sate would be visible as a point in overall line ( which might not be so informative)
something like this;

- Mark as New
- Bookmark
- Subscribe
- Mute
- Subscribe to RSS Feed
- Permalink
- Report Inappropriate Content
Hi,
Please be more specific, your title does not talk to your problem statement. Please provide some more/clear details. It will help others to understand the problem and provide you the solution.
Thanks,
-kamal
- Mark as New
- Bookmark
- Subscribe
- Mute
- Subscribe to RSS Feed
- Permalink
- Report Inappropriate Content
Hello Kamal,
Let me try to explain a bit more. I'm trying to have graph chart which has sales of Country/State/City.
1. The line(graph) indicating the country sales should be displayed all the time.
2. The line indicating sales per state should be displayed only when one states is selected from the list box(i will be having one in the same page).
3. Same with per city sales, this should be displayed only when a city is selected.
So, basically i would like to hide two lines(State and City) and display based on condition.
Please do let me know if this is still unclear.
Thanks!!
- Mark as New
- Bookmark
- Subscribe
- Mute
- Subscribe to RSS Feed
- Permalink
- Report Inappropriate Content
Hi
For this you have to create Drill down Group.
https://intellipaat.com/tutorial/qlikview-tutorial/advanced-features/
Hope it helps!!
- Mark as New
- Bookmark
- Subscribe
- Mute
- Subscribe to RSS Feed
- Permalink
- Report Inappropriate Content
I think like this, when nothing is selected chart will show the sales for all states and when any state is selected chart will show the sales of the city of the selected states.
- Mark as New
- Bookmark
- Subscribe
- Mute
- Subscribe to RSS Feed
- Permalink
- Report Inappropriate Content
Please attach sample data
- Mark as New
- Bookmark
- Subscribe
- Mute
- Subscribe to RSS Feed
- Permalink
- Report Inappropriate Content
or Else you can create 3 buttons and give actions to that Charts Show/Hide
- Mark as New
- Bookmark
- Subscribe
- Mute
- Subscribe to RSS Feed
- Permalink
- Report Inappropriate Content
Hello Kamal,
Thanks much for the example.
In your application if i select a particular State/City the overall sales graph disappears and only the selected option is displayed.
Instead i would like to have the overall graph by default and when there is a State/City selection, the chart should be Overall vs State/City.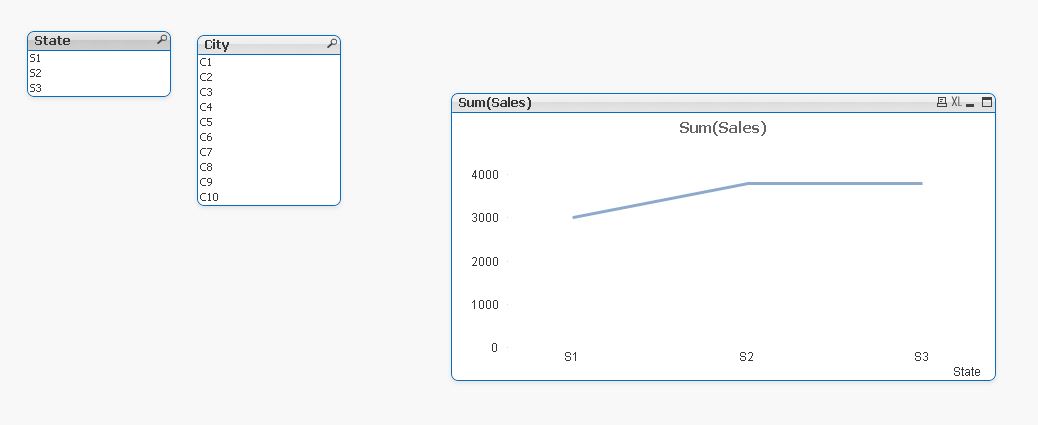
To explain better, i would like to have the above graph always and when a state/city is selected the first attached graph(with selection) should be projected against the whole graph(no selection).
TIA!!
- Mark as New
- Bookmark
- Subscribe
- Mute
- Subscribe to RSS Feed
- Permalink
- Report Inappropriate Content
Hi Anil,
You can consider the data from the app that Kamal attached.
- Mark as New
- Bookmark
- Subscribe
- Mute
- Subscribe to RSS Feed
- Permalink
- Report Inappropriate Content
pls check this-
- « Previous Replies
-
- 1
- 2
- Next Replies »