Unlock a world of possibilities! Login now and discover the exclusive benefits awaiting you.
- Qlik Community
- :
- All Forums
- :
- QlikView App Dev
- :
- Re: Hide dimension with conditions
- Subscribe to RSS Feed
- Mark Topic as New
- Mark Topic as Read
- Float this Topic for Current User
- Bookmark
- Subscribe
- Mute
- Printer Friendly Page
- Mark as New
- Bookmark
- Subscribe
- Mute
- Subscribe to RSS Feed
- Permalink
- Report Inappropriate Content
Hide dimension with conditions
Hi,
I´m beginner using QlikView and I want learn with all of you.
My first question in the community:
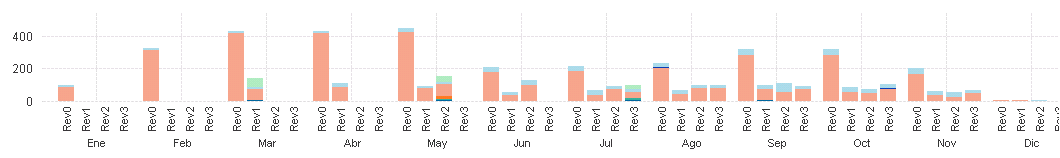
I need hide the dimensions "Rev" with value "0", but not in all months.
Objective:
I have a dimension with 6 values=Rev0,1,2,3,4,5. In the two first months, just want to show the dimension "Rev0". In the two next months, "Rev0" and "Rev1".... and increment showed dimension for each two months.
I checked the option of the properties "Dimensions -> Supress when value is null" and "Presentation -> Supress Zero-Values", but not success.
Help me please.
Thanks.
- Mark as New
- Bookmark
- Subscribe
- Mute
- Subscribe to RSS Feed
- Permalink
- Report Inappropriate Content
Hi,
"Presentation->Supress Zero-Value" only works when all the expressions for a dimension is 0.
Do you have more than 1 expression in the chart, is value for all expressions 0?
Zhihong
- Mark as New
- Bookmark
- Subscribe
- Mute
- Subscribe to RSS Feed
- Permalink
- Report Inappropriate Content
Hi Zhihong He, thanks for answer.
I have just one expression in the chart. I don´t understand "is value for all expressions 0?", sorry.
- Mark as New
- Bookmark
- Subscribe
- Mute
- Subscribe to RSS Feed
- Permalink
- Report Inappropriate Content
Hi,
I don't think that this could be possible in the object. My advice is apply that logic in your script, create a relation between MONTHS and REVs. For the first month (Jan) create an ID for the "Rev0" value, second and third months (Feb & Mar) 2 different IDs for "Rev0" and "Rev1", until get all months related with your REVs. Remember that this new relation is a new dimension for the REVs that you are loading, change the name of the dimension, this will work only in your chart.
Regards,
Enrique.
- Mark as New
- Bookmark
- Subscribe
- Mute
- Subscribe to RSS Feed
- Permalink
- Report Inappropriate Content
Sorry, I mean the value for all the expressions should be 0, then the "suppress 0" works.
As you only have one expression, then that is not the issue.
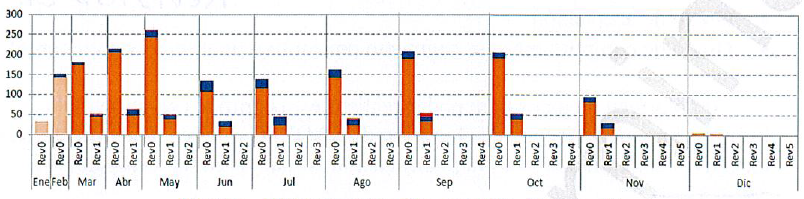
Later I tested, this is not possible for the grouped bar chart. You need to do something as Enrique suggested.
Is that possible you use "Stacked" bar chart? Though can not be exactly the same as Grouped bar chart. You can change to "Stacked" bar chart following steps as below:
Style tab->Subtype setting-> Stacked
Zhihong
- Mark as New
- Bookmark
- Subscribe
- Mute
- Subscribe to RSS Feed
- Permalink
- Report Inappropriate Content
What expression you used to show those. Can you send Dimensions and Expression you are using there?