Unlock a world of possibilities! Login now and discover the exclusive benefits awaiting you.
- Qlik Community
- :
- All Forums
- :
- QlikView App Dev
- :
- Re: Hide legend entry/name in a graph when associa...
- Subscribe to RSS Feed
- Mark Topic as New
- Mark Topic as Read
- Float this Topic for Current User
- Bookmark
- Subscribe
- Mute
- Printer Friendly Page
- Mark as New
- Bookmark
- Subscribe
- Mute
- Subscribe to RSS Feed
- Permalink
- Report Inappropriate Content
Hide legend entry/name in a graph when associated value = zero or blank
Hello everyone,
I have a bar chart with several expression.
When i display the bar chart, there are legends names which don't have value on x axis.
And I want to show only legend when the value >0
Do you know how i can do that ?
Thank you
- Mark as New
- Bookmark
- Subscribe
- Mute
- Subscribe to RSS Feed
- Permalink
- Report Inappropriate Content
Please share us the sample file.
- Mark as New
- Bookmark
- Subscribe
- Mute
- Subscribe to RSS Feed
- Permalink
- Report Inappropriate Content
Here it is
Thank you
- Mark as New
- Bookmark
- Subscribe
- Mute
- Subscribe to RSS Feed
- Permalink
- Report Inappropriate Content
- Mark as New
- Bookmark
- Subscribe
- Mute
- Subscribe to RSS Feed
- Permalink
- Report Inappropriate Content
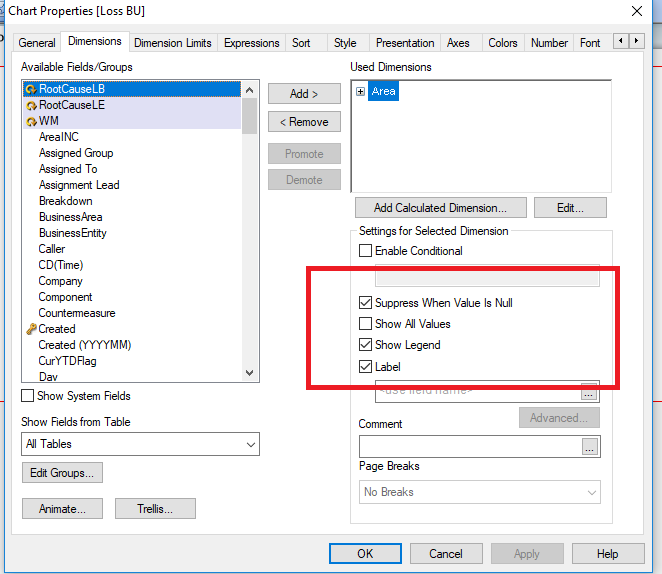
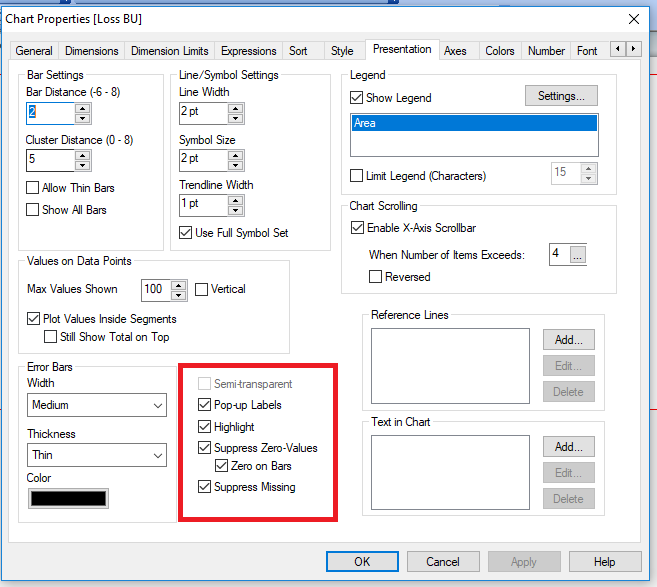
Hi,
Please check this also.
- Mark as New
- Bookmark
- Subscribe
- Mute
- Subscribe to RSS Feed
- Permalink
- Report Inappropriate Content
I tried with this one and it doesn't really work.
Or i think i haven't fully explained correctly my issue.
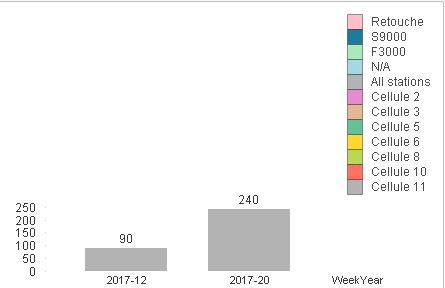
I want to hide the legend entries such as "Retouche" "S9000" "F3000" when they don't have value in the x axis.
In this following example, the x axis are the weekyear.
And i still want to show every week even if the value is 0 but i want to hide the legend entries that have zero values. Because i will add many expressions and i don't want it to be oversaturated.
thank you
- Mark as New
- Bookmark
- Subscribe
- Mute
- Subscribe to RSS Feed
- Permalink
- Report Inappropriate Content
May be, Modify your expression like:
=If(Sales > 0, Sum(Sales))
And check, Suppress zero value option, to filter other data.
- Mark as New
- Bookmark
- Subscribe
- Mute
- Subscribe to RSS Feed
- Permalink
- Report Inappropriate Content
If I do that i get the same result as earlier.
In fact what i want to do actually is not to show expression label (or legend entries) but i still want to show all the the dimension weekyear entirely.