Unlock a world of possibilities! Login now and discover the exclusive benefits awaiting you.
- Qlik Community
- :
- All Forums
- :
- QlikView App Dev
- :
- Re: Hide repeated values when using accumulation i...
- Subscribe to RSS Feed
- Mark Topic as New
- Mark Topic as Read
- Float this Topic for Current User
- Bookmark
- Subscribe
- Mute
- Printer Friendly Page
- Mark as New
- Bookmark
- Subscribe
- Mute
- Subscribe to RSS Feed
- Permalink
- Report Inappropriate Content
Hide repeated values when using accumulation in chart
Hi,
First:
Load * Inline [
Month,Value
Jan, 10
Feb, 15
Mar, 20
Apr, 30
May, 20
Jun, 20
Jul, 20
Aug, 20
Sep, 20
Oct, 20
Nov, 20
Dec, 20
];
Second:
Load * Inline [
Month,Value2
Jan, 10
Feb, 20
Mar, 30
];
I am using line chart with two expression. When I use accumulation(or rangesum), the graph is saturated after March month for second expression(sum(Value2). I want to hide the values in the graph. I tried changing the background color and text color, it didnt work. It was working with Straight Table and Bar chart. I have one problem in Line chart, the graph displays till April Month.
For second Expression: 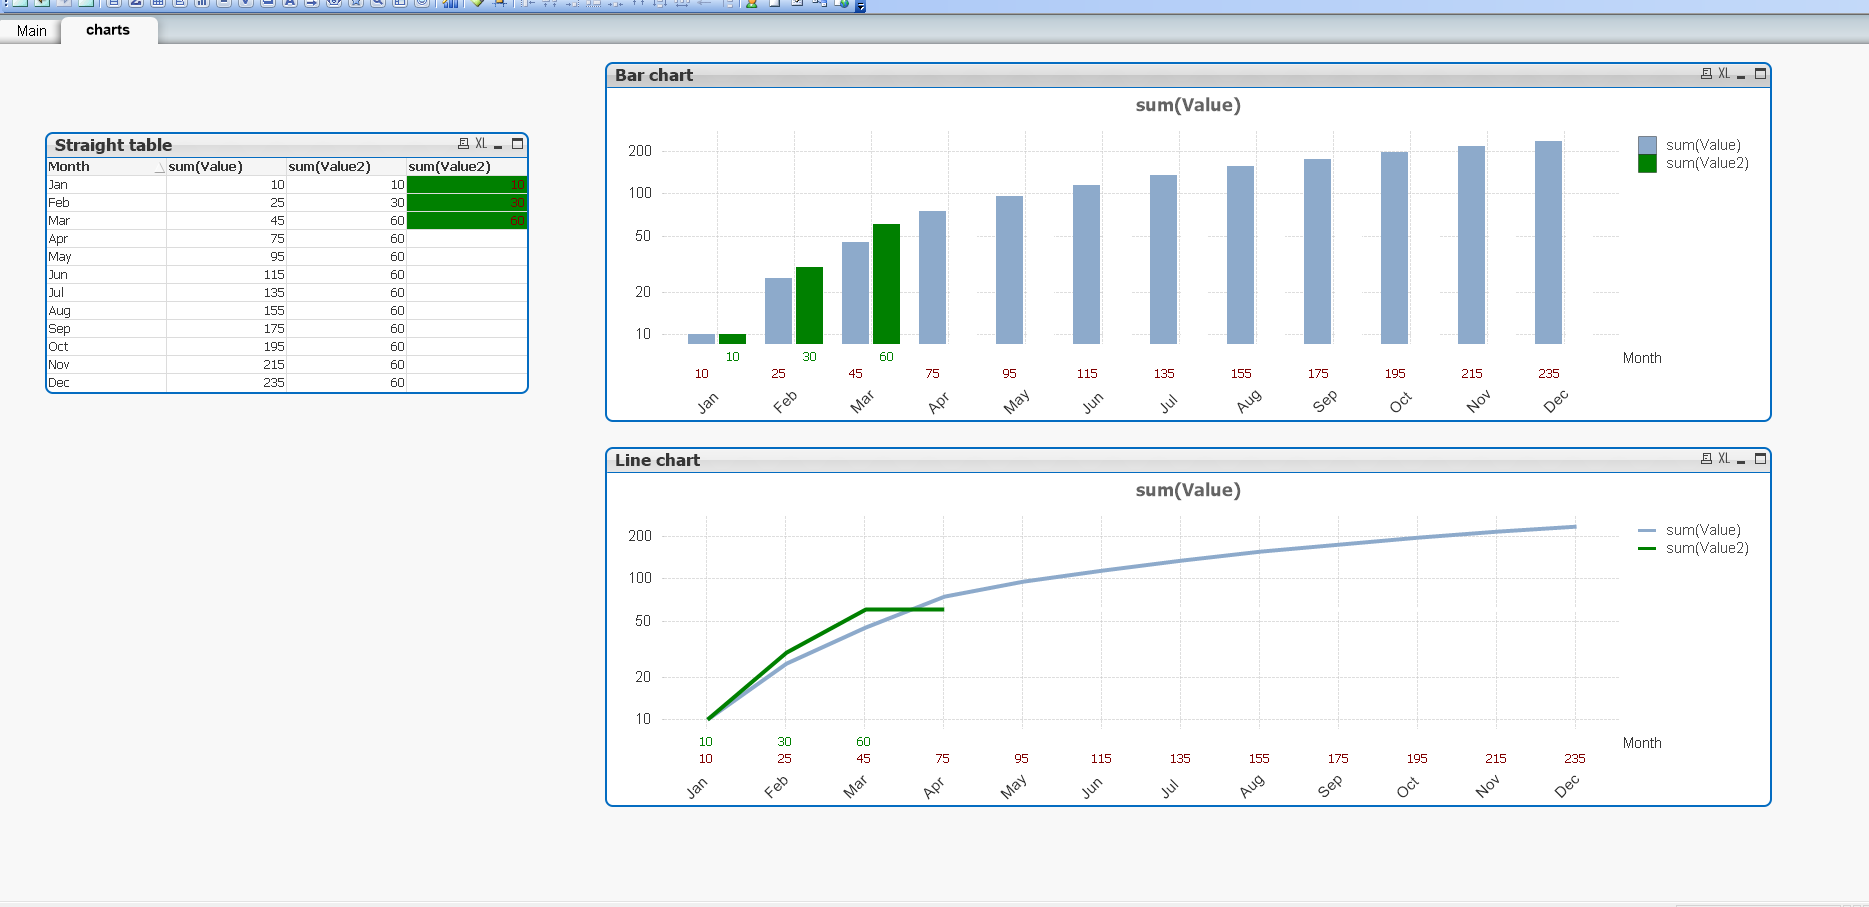
Background color : if(Column(2) =above(sum(Column(1))),White(),green())
Text color : if(Column(2) =above(sum(Column(1))),White(),green())
How to hide the repeated values?
Thanks
Accepted Solutions
- Mark as New
- Bookmark
- Subscribe
- Mute
- Subscribe to RSS Feed
- Permalink
- Report Inappropriate Content
What about doing the check for value already in the expression:
=If(Len(trim(Value2)),Rangesum(Above(Sum(Value2),0,rowno())))
- Mark as New
- Bookmark
- Subscribe
- Mute
- Subscribe to RSS Feed
- Permalink
- Report Inappropriate Content
What about doing the check for value already in the expression:
=If(Len(trim(Value2)),Rangesum(Above(Sum(Value2),0,rowno())))
- Mark as New
- Bookmark
- Subscribe
- Mute
- Subscribe to RSS Feed
- Permalink
- Report Inappropriate Content
Thanks Swuehl. Its working now. .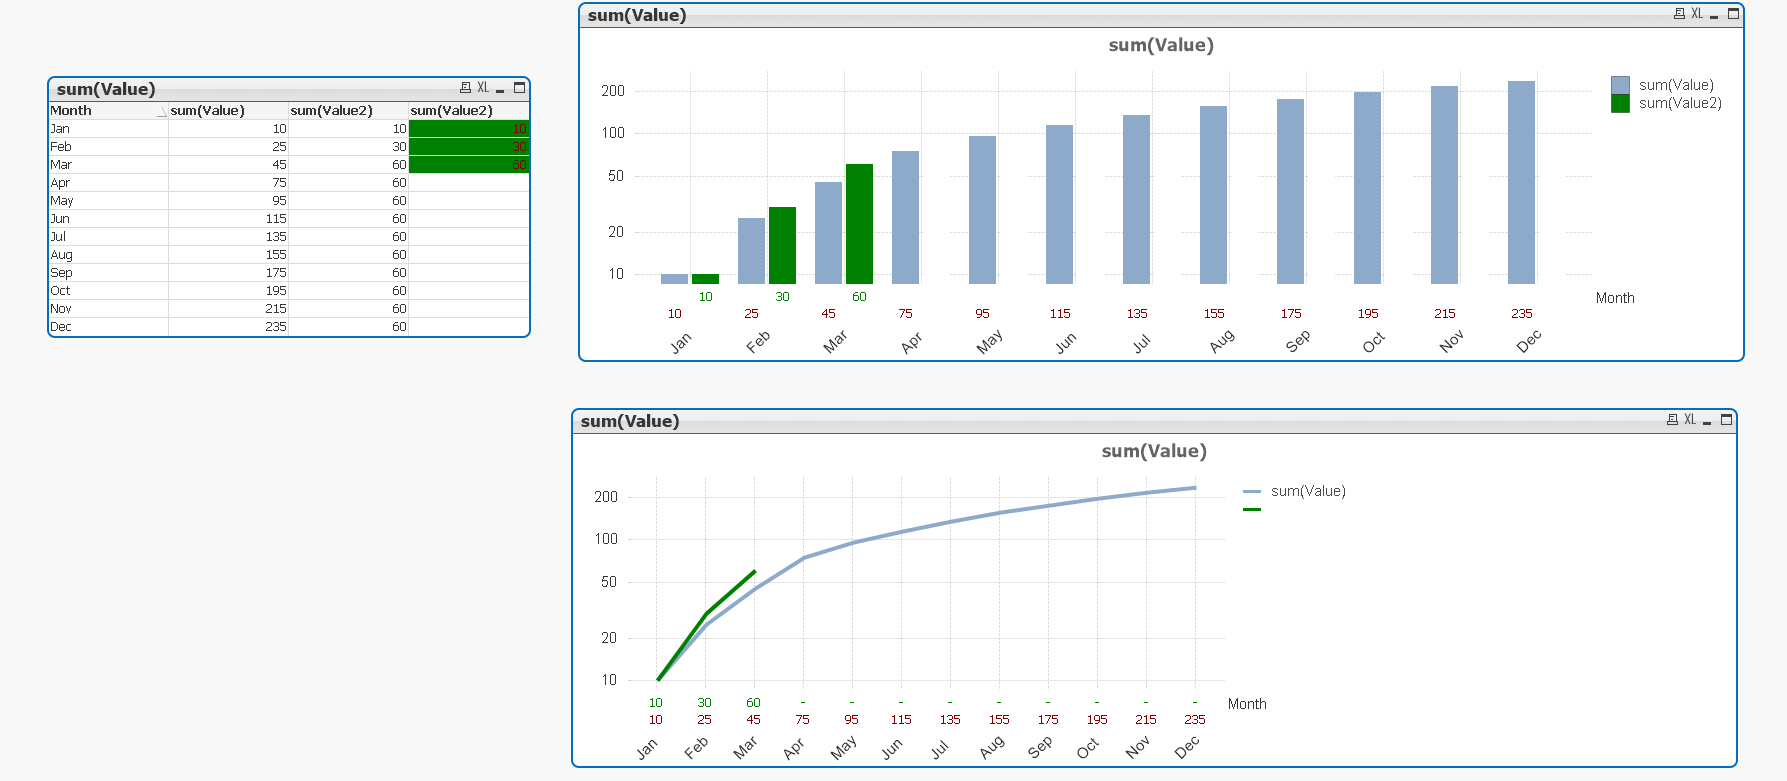
I used rank function in Background color. if(isnum(rank(below(sum(value2))),white(),green())