Unlock a world of possibilities! Login now and discover the exclusive benefits awaiting you.
- Qlik Community
- :
- All Forums
- :
- QlikView App Dev
- :
- Highlight background colour of selection in table
- Subscribe to RSS Feed
- Mark Topic as New
- Mark Topic as Read
- Float this Topic for Current User
- Bookmark
- Subscribe
- Mute
- Printer Friendly Page
- Mark as New
- Bookmark
- Subscribe
- Mute
- Subscribe to RSS Feed
- Permalink
- Report Inappropriate Content
Highlight background colour of selection in table
Is it possible to highlight the background colour of a selection in the following table whilst still showing all the other selections in the table.
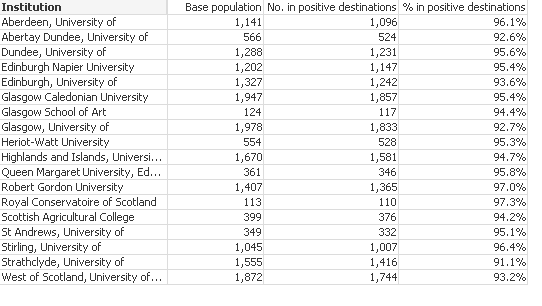
I can highlight the selection using the following background colour expression - =if(GetFieldSelections(institution) = institution, yellow())
However, when I make a selection, all the other institutions disappear from the table.
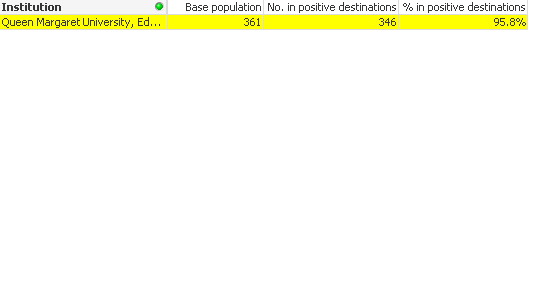
I would like to show all values but highlight the selection. Can this be done?
Thanks
Greg
- « Previous Replies
-
- 1
- 2
- Next Replies »
Accepted Solutions
- Mark as New
- Bookmark
- Subscribe
- Mute
- Subscribe to RSS Feed
- Permalink
- Report Inappropriate Content
Here you go attached. I added
shefcint=,
to the Set Analysis to ignore the Institution field.
Your background color expression only worked if one Institution was selected. I modified it so it would work for multiple Institutions.
=if(count(DISTINCT TOTAL shefcint) < count({<shefcint=>}DISTINCT TOTAL shefcint)
AND
shefcint = shefcint, RGB(0,255,0))
-Rob
- Mark as New
- Bookmark
- Subscribe
- Mute
- Subscribe to RSS Feed
- Permalink
- Report Inappropriate Content
Its qlikview inherit property that it will slice and dice the data when selections are made.
Other way would be you need to add {1} in your expression not get altered when selections are made.
- Mark as New
- Bookmark
- Subscribe
- Mute
- Subscribe to RSS Feed
- Permalink
- Report Inappropriate Content
Hi Gregg,
what is your set analysis?
Add {1} should ignore you selections and achieve what you want.
Something like
SUM({1}Amount)
Mark
- Mark as New
- Bookmark
- Subscribe
- Mute
- Subscribe to RSS Feed
- Permalink
- Report Inappropriate Content
try using set analysis
[Base population=sum({<Institution=>}your value)
and use your Color definition
when you select one Institution, you will see the whole table and hopefully with the selected Institution in yellow
- Mark as New
- Bookmark
- Subscribe
- Mute
- Subscribe to RSS Feed
- Permalink
- Report Inappropriate Content
Thanks Mark
My set analysis for this expression is Sum({$<source={'DLHE'},sfcactivity ={'A 1. Full-time work',
'B 2. Part-time work',
'C 3. Primarily in work and also studying',
'D 4. Primarily studying and also in work',
'E 5. Full-time study',
'F 6. Part-time study',
'G 7. Due to start work',
'H 8. Unemployed'}>}(head))
How/where do I incorporate the {1}
Thanks
Greg
- Mark as New
- Bookmark
- Subscribe
- Mute
- Subscribe to RSS Feed
- Permalink
- Report Inappropriate Content
Hi
You could try putting a number 1 to indicate select from whole data model in your expression (not in the background formatting but the actual expression) . This will show your background colour on all expressions but won't on the dimension.
- Mark as New
- Bookmark
- Subscribe
- Mute
- Subscribe to RSS Feed
- Permalink
- Report Inappropriate Content
Replace $ with 1
Sum({1<source={'DLHE'},sfcactivity ={'A 1. Full-time work',
'B 2. Part-time work',
'C 3. Primarily in work and also studying',
'D 4. Primarily studying and also in work',
'E 5. Full-time study',
'F 6. Part-time study',
'G 7. Due to start work',
'H 8. Unemployed'}>}(head))
Please go through the set analysis,
- Mark as New
- Bookmark
- Subscribe
- Mute
- Subscribe to RSS Feed
- Permalink
- Report Inappropriate Content
Thanks, but this now add together all my years instead of showing table for selected year. I would like it to reflect all other selections except for the 'institution'. Is that possible?
- Mark as New
- Bookmark
- Subscribe
- Mute
- Subscribe to RSS Feed
- Permalink
- Report Inappropriate Content
Hi Greg,
You're going a bit against the Qlikview grain here I'm afraid. If you make a selection in the chart you're excluding the other records so they will, by dint of the associative model, disappear from the chart.
Also when you select in a chart green is the standard colour to show the selection. You have a choice of different shades but, unless you want to go under the bonnet, green it is.
Your best choice might be add an Institution field to your data model in a data island table unconnected to the other dimensions or facts, call it Institution1 or something with the same elements as the original field. Select your Institution1 in a listbox or a search object and you can change the colour of your chart for those records whose value of Institution is among those selected in the field Institution1.
Best of luck
Andrew
- Mark as New
- Bookmark
- Subscribe
- Mute
- Subscribe to RSS Feed
- Permalink
- Report Inappropriate Content
I think you need to ignore the instituiton field name in the set analysis.
Sum({1<source={'DLHE'},sfcactivity ={'A 1. Full-time work',
'B 2. Part-time work',
'C 3. Primarily in work and also studying',
'D 4. Primarily studying and also in work',
'E 5. Full-time study',
'F 6. Part-time study',
'G 7. Due to start work',
'H 8. Unemployed'} , Institution =>}(head))
- « Previous Replies
-
- 1
- 2
- Next Replies »