Unlock a world of possibilities! Login now and discover the exclusive benefits awaiting you.
- Qlik Community
- :
- All Forums
- :
- QlikView App Dev
- :
- Re: Highlight max and min values in pivot table
- Subscribe to RSS Feed
- Mark Topic as New
- Mark Topic as Read
- Float this Topic for Current User
- Bookmark
- Subscribe
- Mute
- Printer Friendly Page
- Mark as New
- Bookmark
- Subscribe
- Mute
- Subscribe to RSS Feed
- Permalink
- Report Inappropriate Content
Highlight max and min values in pivot table
Hi all!
I have a Pivot Table with many dimensions and one expression. Is it possible to highlight the cells that contain max and min expression values, depending on the current aggregations?
Kindest Regards.
- « Previous Replies
- Next Replies »
Accepted Solutions
- Mark as New
- Bookmark
- Subscribe
- Mute
- Subscribe to RSS Feed
- Permalink
- Report Inappropriate Content
Hi all,
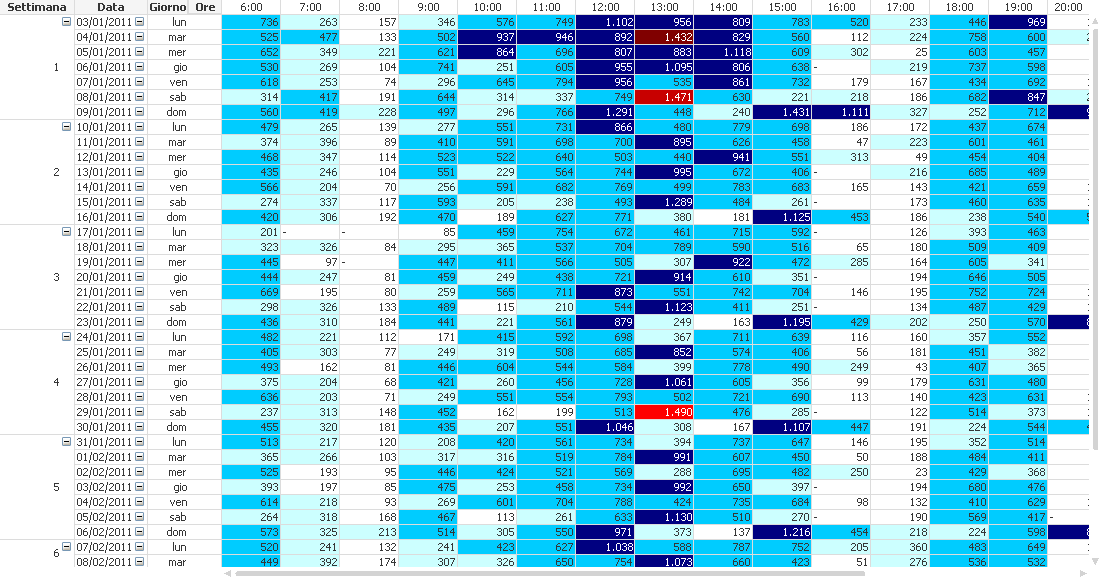
we have a pivot table with these dimensions
Week (Settimana)
Data (Date)
Ora (Hour)
Expresssion: QtaPasseggeri (quantity of passengers)
with espression sum(QtaPasseggeri) and expression name "Passeggeri".
The solution for this problem is to set this expression in Background Color
if([Passeggeri]=max(total aggr(sum(QtaPasseggeri), Settimana, Data, Ore),1), rgb(255,0,0),
if([Passeggeri]=max(total aggr(sum(QtaPasseggeri), Settimana, Data, Ore),2), rgb(200,0,0),
if([Passeggeri]=max(total aggr(sum(QtaPasseggeri), Settimana, Data, Ore),3), red(),
IF([Passeggeri]>800,
RGB(0,0,128),
IF([Passeggeri]>400 AND [Passeggeri]<800,
RGB(0,204,255),
IF([Passeggeri]>200 AND [Passeggeri]<400, RGB(204, 255, 255))
)
)
)
)
)
Regards
Luca Jonathan Panetta
- Mark as New
- Bookmark
- Subscribe
- Mute
- Subscribe to RSS Feed
- Permalink
- Report Inappropriate Content
Hi,
Write some thing like this in background properties of the expressions by click on plus sign.
If( Sum(Sales) = Max(Sales) ,Yellow(),
If( Sum(Sales) = Min(Sales) ,Green() ))
Rgds
Anand
- Mark as New
- Bookmark
- Subscribe
- Mute
- Subscribe to RSS Feed
- Permalink
- Report Inappropriate Content
No, it doesn't works. Your example draws all the cells with a yellow background.
- Mark as New
- Bookmark
- Subscribe
- Mute
- Subscribe to RSS Feed
- Permalink
- Report Inappropriate Content
Hi,
Can you share any sample file it goes so easy.
Rgds
Anand
- Mark as New
- Bookmark
- Subscribe
- Mute
- Subscribe to RSS Feed
- Permalink
- Report Inappropriate Content
1.go to chart properties of pivot table and go to tab visual cues.
2.select expression and give upper limit and lower limit.
3.Then the values between upper and lower limit will be highlighted.
try it out.
regards
- Mark as New
- Bookmark
- Subscribe
- Mute
- Subscribe to RSS Feed
- Permalink
- Report Inappropriate Content
You can do one more thing..
Go in the visual cues tab....Here yo u will find the Upper and Lower Value....you can fix the color according to your reqirement
- Mark as New
- Bookmark
- Subscribe
- Mute
- Subscribe to RSS Feed
- Permalink
- Report Inappropriate Content
I have the same question. But I ordered the values ascendant by this expression:
min(aggr(count(Field), Dimension 1, Dimension 2))
But doesn't order. I want min values on the top of the table so I can highlight them and the max values down.
- Mark as New
- Bookmark
- Subscribe
- Mute
- Subscribe to RSS Feed
- Permalink
- Report Inappropriate Content
Please attach the application. We all can help you out with that!
- Mark as New
- Bookmark
- Subscribe
- Mute
- Subscribe to RSS Feed
- Permalink
- Report Inappropriate Content
Hi,
Write some thing like this in background properties of the expressions by click on plus sign.
If( Sum(Sales) = Max(Sales) OR Sum(Sales) = Min(Sales) ,Yellow())
Hope this helps!
Thanks,
Attitude
- Mark as New
- Bookmark
- Subscribe
- Mute
- Subscribe to RSS Feed
- Permalink
- Report Inappropriate Content
If( Sum(Sales) = Max(Sales) OR Sum(Sales) = Min(Sales) ,Yellow()) doesn't work.
This is the example. I want max and min values by Field2.
- « Previous Replies
- Next Replies »