Unlock a world of possibilities! Login now and discover the exclusive benefits awaiting you.
- Qlik Community
- :
- All Forums
- :
- QlikView App Dev
- :
- Re: Highlight row where multiple fields have an an...
- Subscribe to RSS Feed
- Mark Topic as New
- Mark Topic as Read
- Float this Topic for Current User
- Bookmark
- Subscribe
- Mute
- Printer Friendly Page
- Mark as New
- Bookmark
- Subscribe
- Mute
- Subscribe to RSS Feed
- Permalink
- Report Inappropriate Content
Highlight row where multiple fields have an answer of 'yes'
We utilize qlik with a client database. I'm trying to highlight rows based on vulnerability or client existing with a greater need (low(green), medium(yellow), high(red)). There are a series of questions like [dental services]={'Yes'}, [financial counseling]={'Yes'}, [rent payment]={'Yes'} etc. I'm trying to show where each unique client ID indicates yes one time (highlight green), where yes appears twice (highlight yellow), where yes appears 3 or more times (highlight red).
Is this possible? If so, can I also turn this into a filter?
Thanks, Brittany
Accepted Solutions
- Mark as New
- Bookmark
- Subscribe
- Mute
- Subscribe to RSS Feed
- Permalink
- Report Inappropriate Content
better way is to create a flags in script. You can create the flags for each individual column having values yes like below
Data:
load
if(Field1='yes',1,0) as Flag_field1
if(Field2='yes',1,0) as Flag_field2,
if(Field3='yes',1,0) as Flag_field3,
......
From source;
Here, Field1, Field2, Field3 are the fields having values yes or no which you can replace with your actual field names
Now in your Qlikview chart you can write below formula in background color expression
Note: You need to write this formula in background color of all your dimensions and expressions
= if(rangesum(Flag_field1,Flag_field2,Flag_field3)=1, green(),
if(rangesum(Flag_field1,Flag_field2,Flag_field3)=2, yellow(),
if(rangesum(Flag_field1,Flag_field2,Flag_field3)>=3, red())))
Note: In above rangesum formula include all the flags
If you don't want to create flags in script then write below formula in background color expression
if(rangesum(if(Field1='yes',1,0),
if(Field2='yes',1,0),
if(Field3='yes',1,0))=1, green(),
if(rangesum(if(Field1='yes',1,0),
if(Field2='yes',1,0),
if(Field3='yes',1,0))=2, yellow(),
if(rangesum( if(Field1='yes',1,0),
if(Field2='yes',1,0),
if(Field3='yes',1,0))>=3, red())))
Again within rangesum include if statements for each Fields.
- Mark as New
- Bookmark
- Subscribe
- Mute
- Subscribe to RSS Feed
- Permalink
- Report Inappropriate Content
just to give you an idea.
Expression wise you can write an expression to background color
if( count([dental services]={'Yes'} Client_ID) =1, green(),
	if( count([dental services]={'Yes'} Client_ID) =2, yellow(),
		if( count([dental services]={'Yes'} Client_ID) =2, red())))
But i would really recommend you to calculate that as a new column in script.
That also gives you an easy option to use that column in a filter.
- Mark as New
- Bookmark
- Subscribe
- Mute
- Subscribe to RSS Feed
- Permalink
- Report Inappropriate Content
Thanks for the feedback.
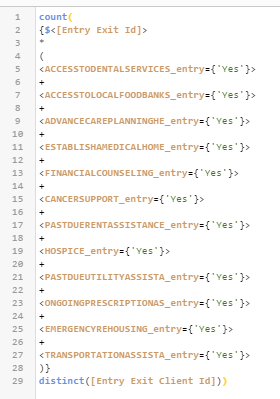
The expression below counts the number of clients with a 'yes' regardless of the occurrence but am not sure how to sum the values of 'yes' regardless of which field it's coming from.
Below is a visual of what's being captured. Thank you for the color guidance.
- Mark as New
- Bookmark
- Subscribe
- Mute
- Subscribe to RSS Feed
- Permalink
- Report Inappropriate Content
Would you be able to share a sample?
- Mark as New
- Bookmark
- Subscribe
- Mute
- Subscribe to RSS Feed
- Permalink
- Report Inappropriate Content
In your screenshot of the visual of what's being captured... What do you want different about it? Could you explain a little more about what the logic needs to be?
Thanks,
Ben
- Mark as New
- Bookmark
- Subscribe
- Mute
- Subscribe to RSS Feed
- Permalink
- Report Inappropriate Content
The example being shown is from excel, not qlik. I want the visual to appear in qlik but I only know how to count the 1 client where a yes occurs, not the sum of yes' per client ID.
- Mark as New
- Bookmark
- Subscribe
- Mute
- Subscribe to RSS Feed
- Permalink
- Report Inappropriate Content
better way is to create a flags in script. You can create the flags for each individual column having values yes like below
Data:
load
if(Field1='yes',1,0) as Flag_field1
if(Field2='yes',1,0) as Flag_field2,
if(Field3='yes',1,0) as Flag_field3,
......
From source;
Here, Field1, Field2, Field3 are the fields having values yes or no which you can replace with your actual field names
Now in your Qlikview chart you can write below formula in background color expression
Note: You need to write this formula in background color of all your dimensions and expressions
= if(rangesum(Flag_field1,Flag_field2,Flag_field3)=1, green(),
if(rangesum(Flag_field1,Flag_field2,Flag_field3)=2, yellow(),
if(rangesum(Flag_field1,Flag_field2,Flag_field3)>=3, red())))
Note: In above rangesum formula include all the flags
If you don't want to create flags in script then write below formula in background color expression
if(rangesum(if(Field1='yes',1,0),
if(Field2='yes',1,0),
if(Field3='yes',1,0))=1, green(),
if(rangesum(if(Field1='yes',1,0),
if(Field2='yes',1,0),
if(Field3='yes',1,0))=2, yellow(),
if(rangesum( if(Field1='yes',1,0),
if(Field2='yes',1,0),
if(Field3='yes',1,0))>=3, red())))
Again within rangesum include if statements for each Fields.


