Unlock a world of possibilities! Login now and discover the exclusive benefits awaiting you.
- Qlik Community
- :
- All Forums
- :
- QlikView App Dev
- :
- How can I realize this excel forecast in Qlikview?
- Subscribe to RSS Feed
- Mark Topic as New
- Mark Topic as Read
- Float this Topic for Current User
- Bookmark
- Subscribe
- Mute
- Printer Friendly Page
- Mark as New
- Bookmark
- Subscribe
- Mute
- Subscribe to RSS Feed
- Permalink
- Report Inappropriate Content
How can I realize this excel forecast in Qlikview?
Hi folks,
I'm having problem designing this part usage forecast sheet in Qilkview.
Basically we are using the actual usage from the past periods (column B) to forecast the future usage (column C)
Cell B13= =IF((A13>$B$4), IF(B12<>"",SUM(OFFSET(C13,-1,-1,-$B$4,1))/$B$4,C12),"")
Can we realize OFFSET function in Qlikview?

Accepted Solutions
- Mark as New
- Bookmark
- Subscribe
- Mute
- Subscribe to RSS Feed
- Permalink
- Report Inappropriate Content
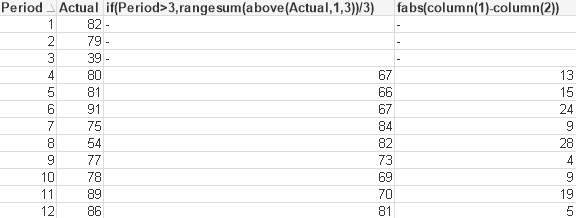
That said (shown?) I probably would do it with an AsOf table instead. It's more complicated but if you select the period in the chart, the data will remain the same, where with the previous, it will no longer display correctly because it's trying to look at other cells in the same chart that you've now removed. The AsOf table has you looking at other rows in the data model, so it still works, even though they've been removed from the chart. Anyway, you can see that in the attached by clicking on a period in either chart. If you click on a period in the first chart, the data changes. If you click on an AsOfPeriod in the second chart, the data remains the same.
- Mark as New
- Bookmark
- Subscribe
- Mute
- Subscribe to RSS Feed
- Permalink
- Report Inappropriate Content
- Mark as New
- Bookmark
- Subscribe
- Mute
- Subscribe to RSS Feed
- Permalink
- Report Inappropriate Content
That said (shown?) I probably would do it with an AsOf table instead. It's more complicated but if you select the period in the chart, the data will remain the same, where with the previous, it will no longer display correctly because it's trying to look at other cells in the same chart that you've now removed. The AsOf table has you looking at other rows in the data model, so it still works, even though they've been removed from the chart. Anyway, you can see that in the attached by clicking on a period in either chart. If you click on a period in the first chart, the data changes. If you click on an AsOfPeriod in the second chart, the data remains the same.
- Mark as New
- Bookmark
- Subscribe
- Mute
- Subscribe to RSS Feed
- Permalink
- Report Inappropriate Content
Thank you, John~! You are awesome!