Unlock a world of possibilities! Login now and discover the exclusive benefits awaiting you.
- Qlik Community
- :
- All Forums
- :
- QlikView App Dev
- :
- How do I add a new column in tableviewer after cro...
- Subscribe to RSS Feed
- Mark Topic as New
- Mark Topic as Read
- Float this Topic for Current User
- Bookmark
- Subscribe
- Mute
- Printer Friendly Page
- Mark as New
- Bookmark
- Subscribe
- Mute
- Subscribe to RSS Feed
- Permalink
- Report Inappropriate Content
How do I add a new column in tableviewer after crosstable
Hello,
Somewhat new to Qlikview and I've run into a question which I'm sure has a simple answer, but I can't quite figure it out. In the attached spreadsheet (my raw data) I have three tabs:
- first tab shows data in the form in which it is being delivered to me (this will be refreshed periodically)
- second tab shows how the data is organized in my tableviewer after using the crosstable function
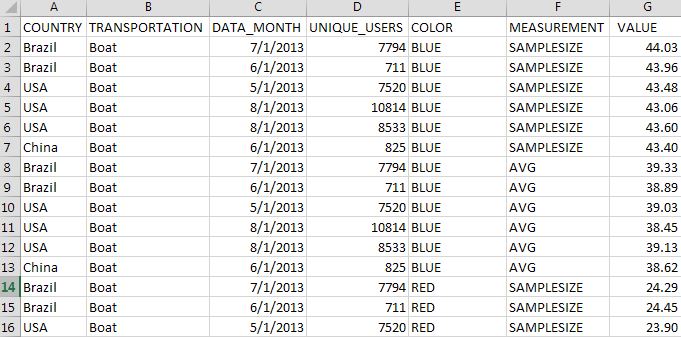
- third tab shows how I'd like to ultimately show the data in my tableviewer, using Qlikview functions
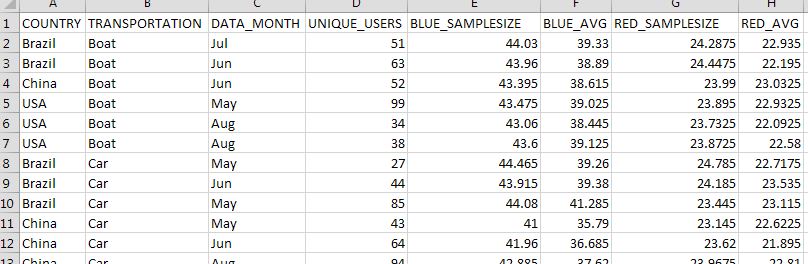
ORIGINAL DATA
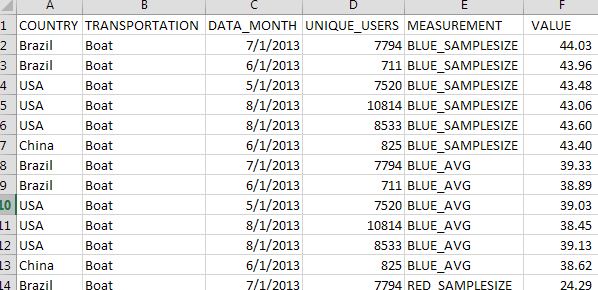
ORGANIZATION AFTER CROSSTABLE (rows E-I transposed into "measurement" and "value" columns):
Next step/question: which functions can I use to 1) create a column for the color, 2) pull the color from column F, and 3) clean-up column F to show only the measurement type?
This newbie greatly appreciates your feedback.
Accepted Solutions
- Mark as New
- Bookmark
- Subscribe
- Mute
- Subscribe to RSS Feed
- Permalink
- Report Inappropriate Content
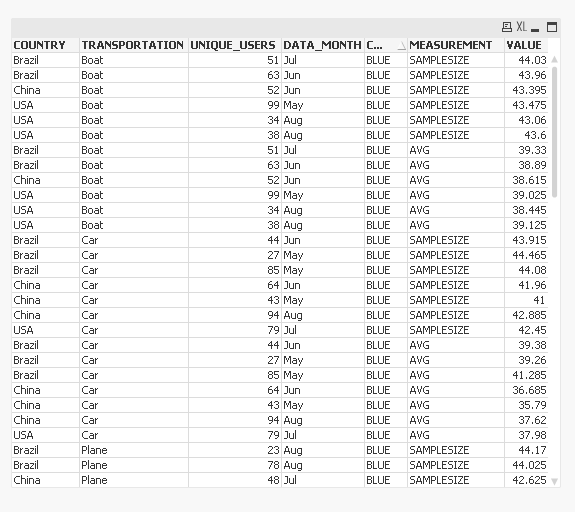
Try this:
Transportation:
CrossTable(MEASUREMENT, VALUE, 4)
LOAD COUNTRY,
TRANSPORTATION,
UNIQUE_USERS,
DATA_MONTH,
BLUE_SAMPLESIZE,
BLUE_AVG,
RED_SAMPLESIZE,
RED_AVG
FROM
[SampleFile-kimrca.xlsx]
(ooxml, embedded labels, table is [ORIGINAL DATA]);
FinalTable:
LOAD COUNTRY,
TRANSPORTATION,
UNIQUE_USERS,
DATA_MONTH,
SubField(MEASUREMENT, '_', 1) as COLOR,
SubField(MEASUREMENT, '_', 2) as MEASUREMENT,
VALUE
Resident Transportation;
DROP Table Transportation;
- Mark as New
- Bookmark
- Subscribe
- Mute
- Subscribe to RSS Feed
- Permalink
- Report Inappropriate Content
Try this:
Transportation:
CrossTable(MEASUREMENT, VALUE, 4)
LOAD COUNTRY,
TRANSPORTATION,
UNIQUE_USERS,
DATA_MONTH,
BLUE_SAMPLESIZE,
BLUE_AVG,
RED_SAMPLESIZE,
RED_AVG
FROM
[SampleFile-kimrca.xlsx]
(ooxml, embedded labels, table is [ORIGINAL DATA]);
FinalTable:
LOAD COUNTRY,
TRANSPORTATION,
UNIQUE_USERS,
DATA_MONTH,
SubField(MEASUREMENT, '_', 1) as COLOR,
SubField(MEASUREMENT, '_', 2) as MEASUREMENT,
VALUE
Resident Transportation;
DROP Table Transportation;